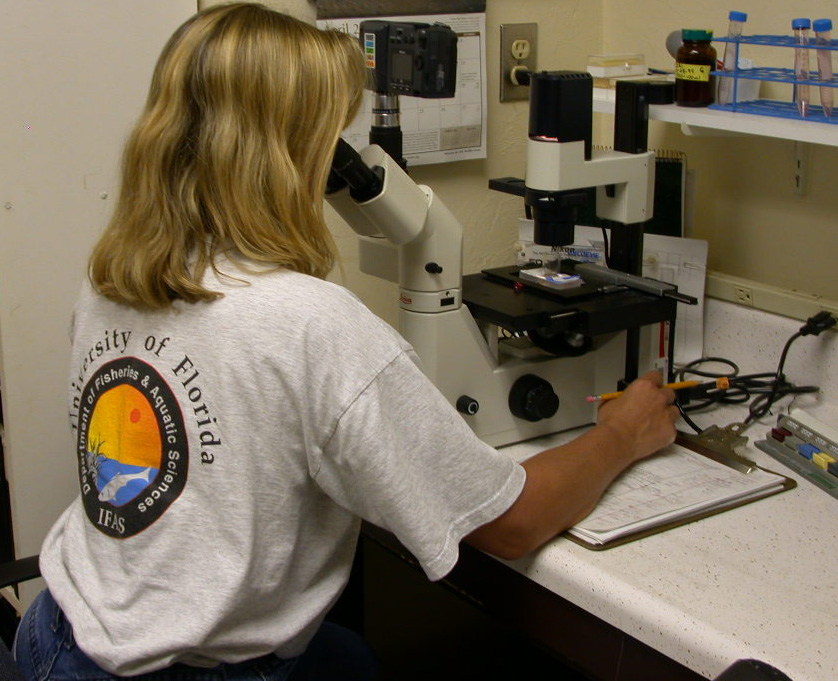
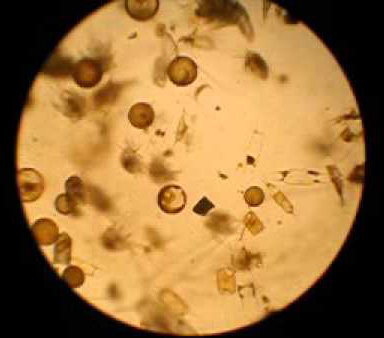
The amount of phytoplankton in the water can be determined by placing a water sample under a microscope, then identifying and counting the number of individuals. This technique allows scientists to determine which species (and how many of each) are present. Size estimates can also be made, which, when totaled, give an estimate of total phytoplankton biomass in the water at the site and time of sampling. Biomass is an excellent measure of food availability in the form of phytoplankton.
Microscope counts are useful because they indicate more than just how much food is available, but the potential quality of the food. Although most species of phytoplankton are acceptable food items, some are more nutritious or more digestible than others. Also, some species have the potential to create harmful environmental conditions or cause direct harm to hard clams and/or humans that consume them.
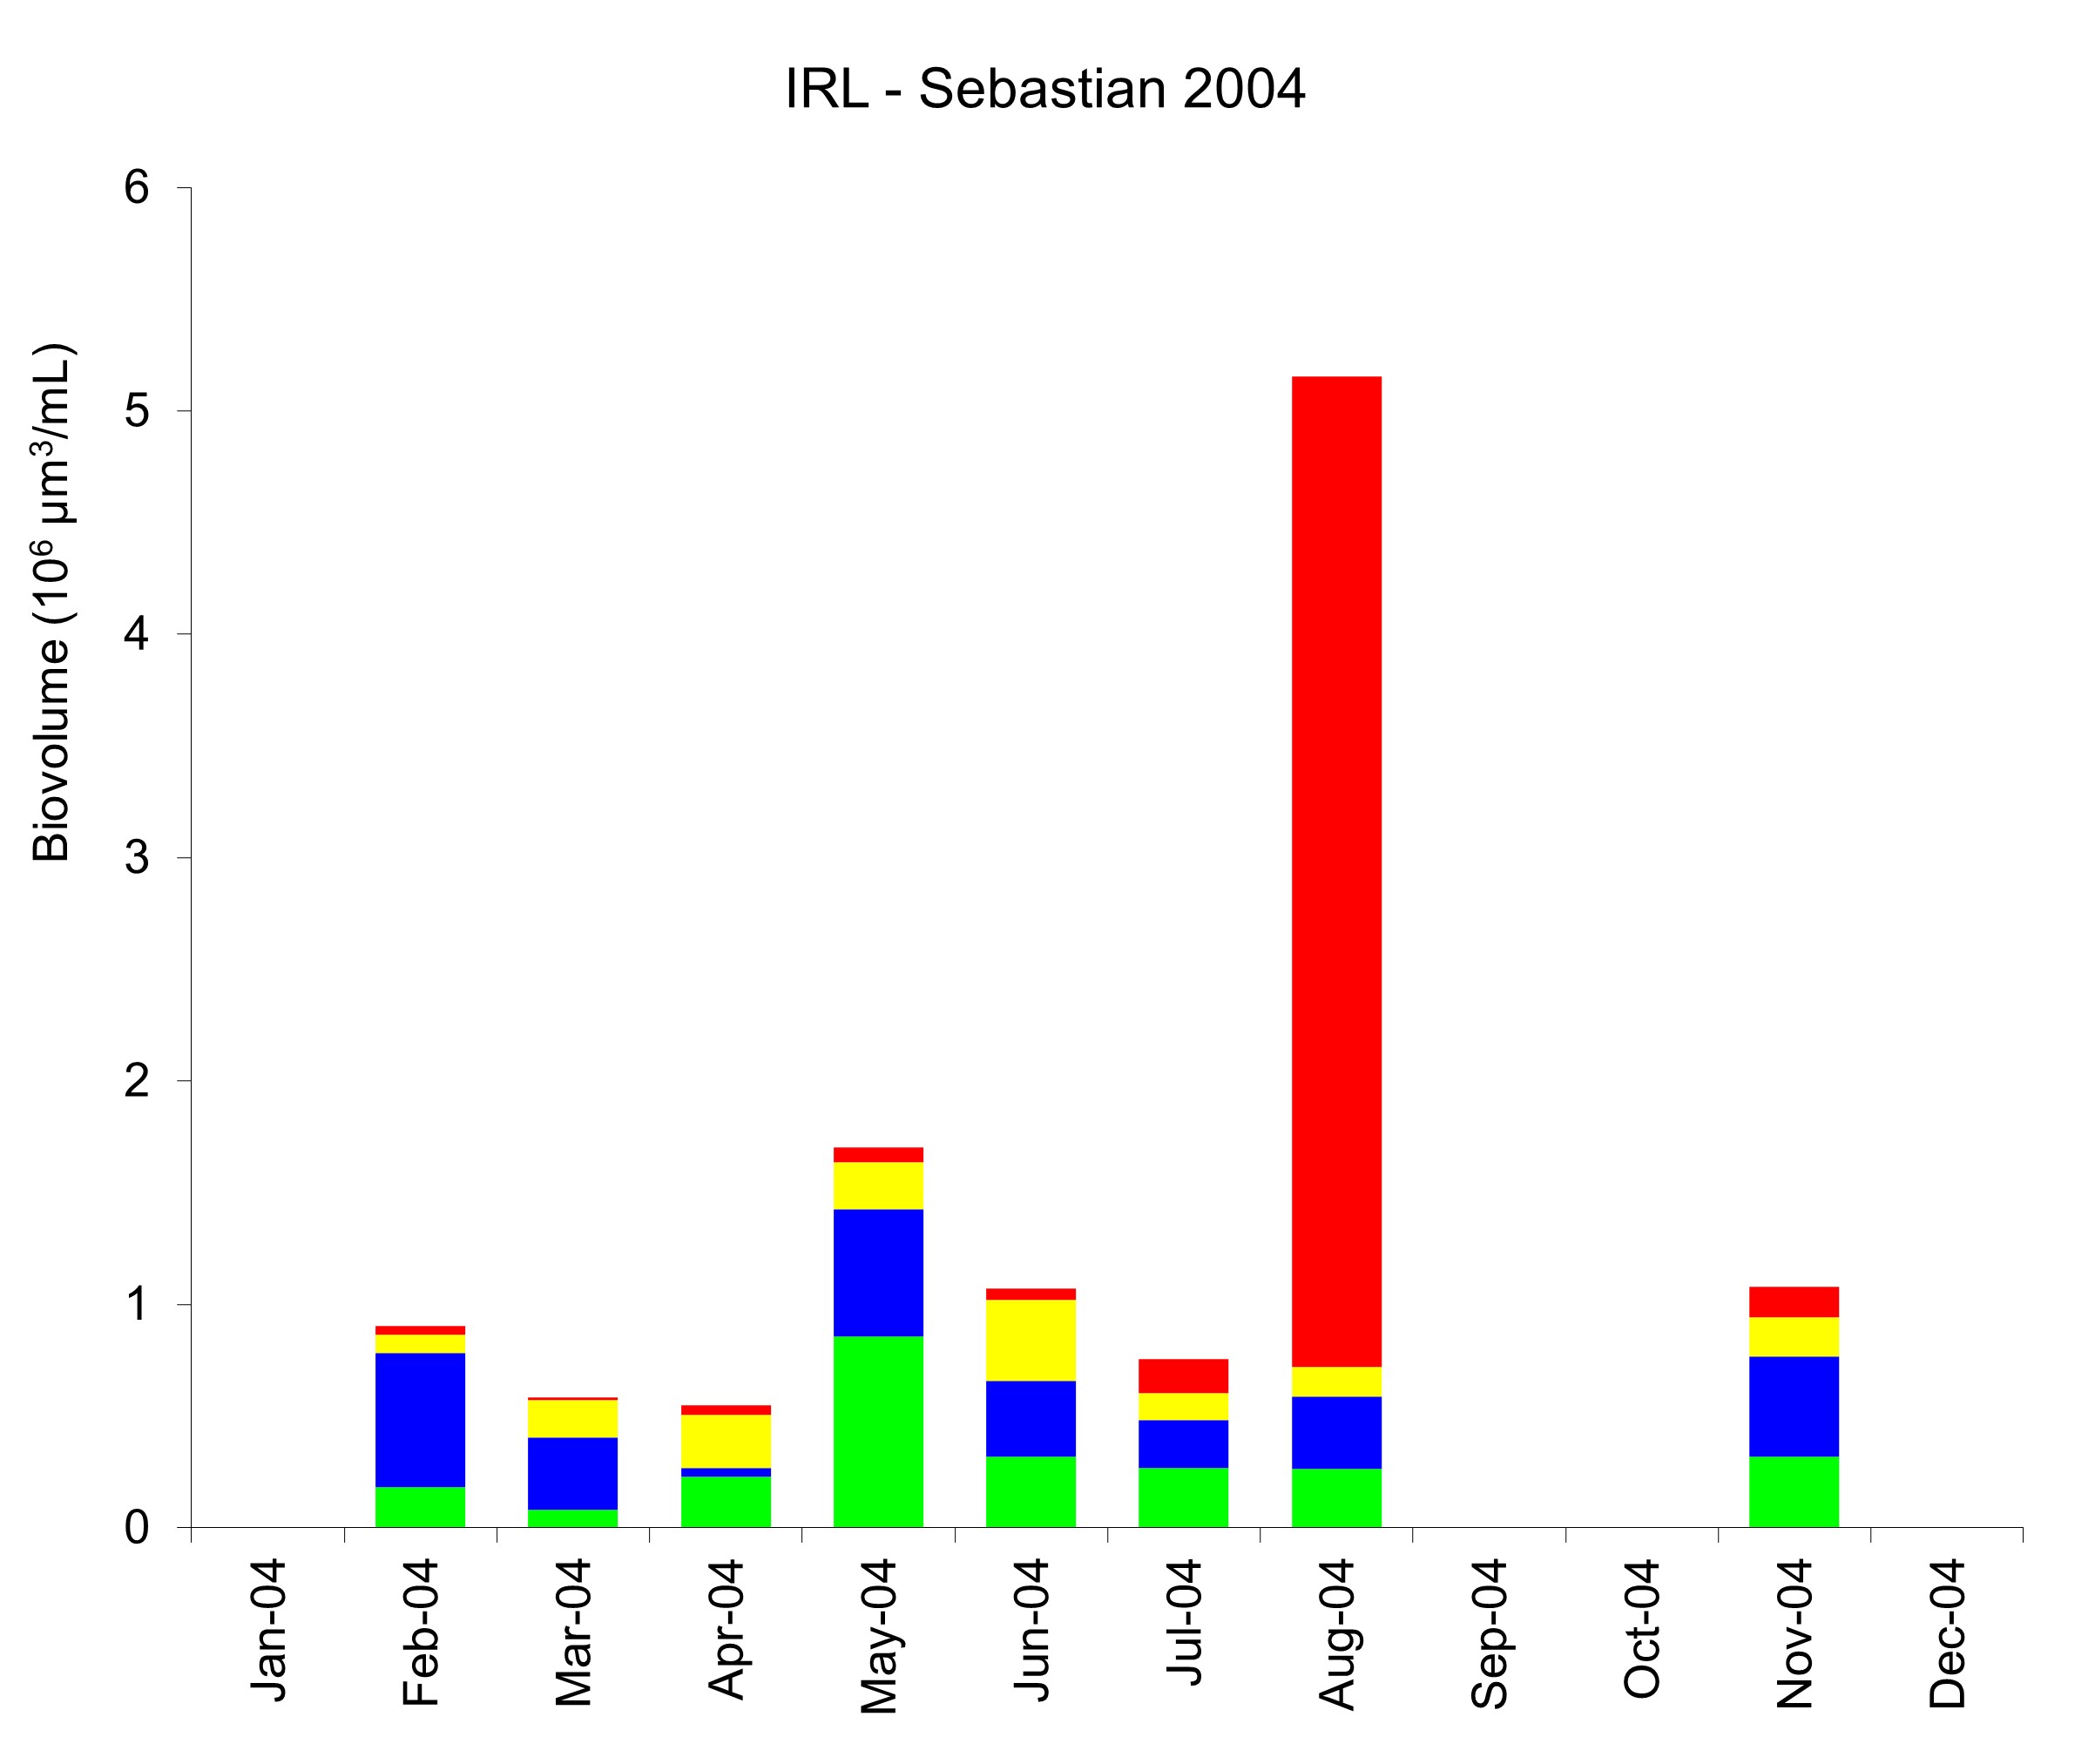
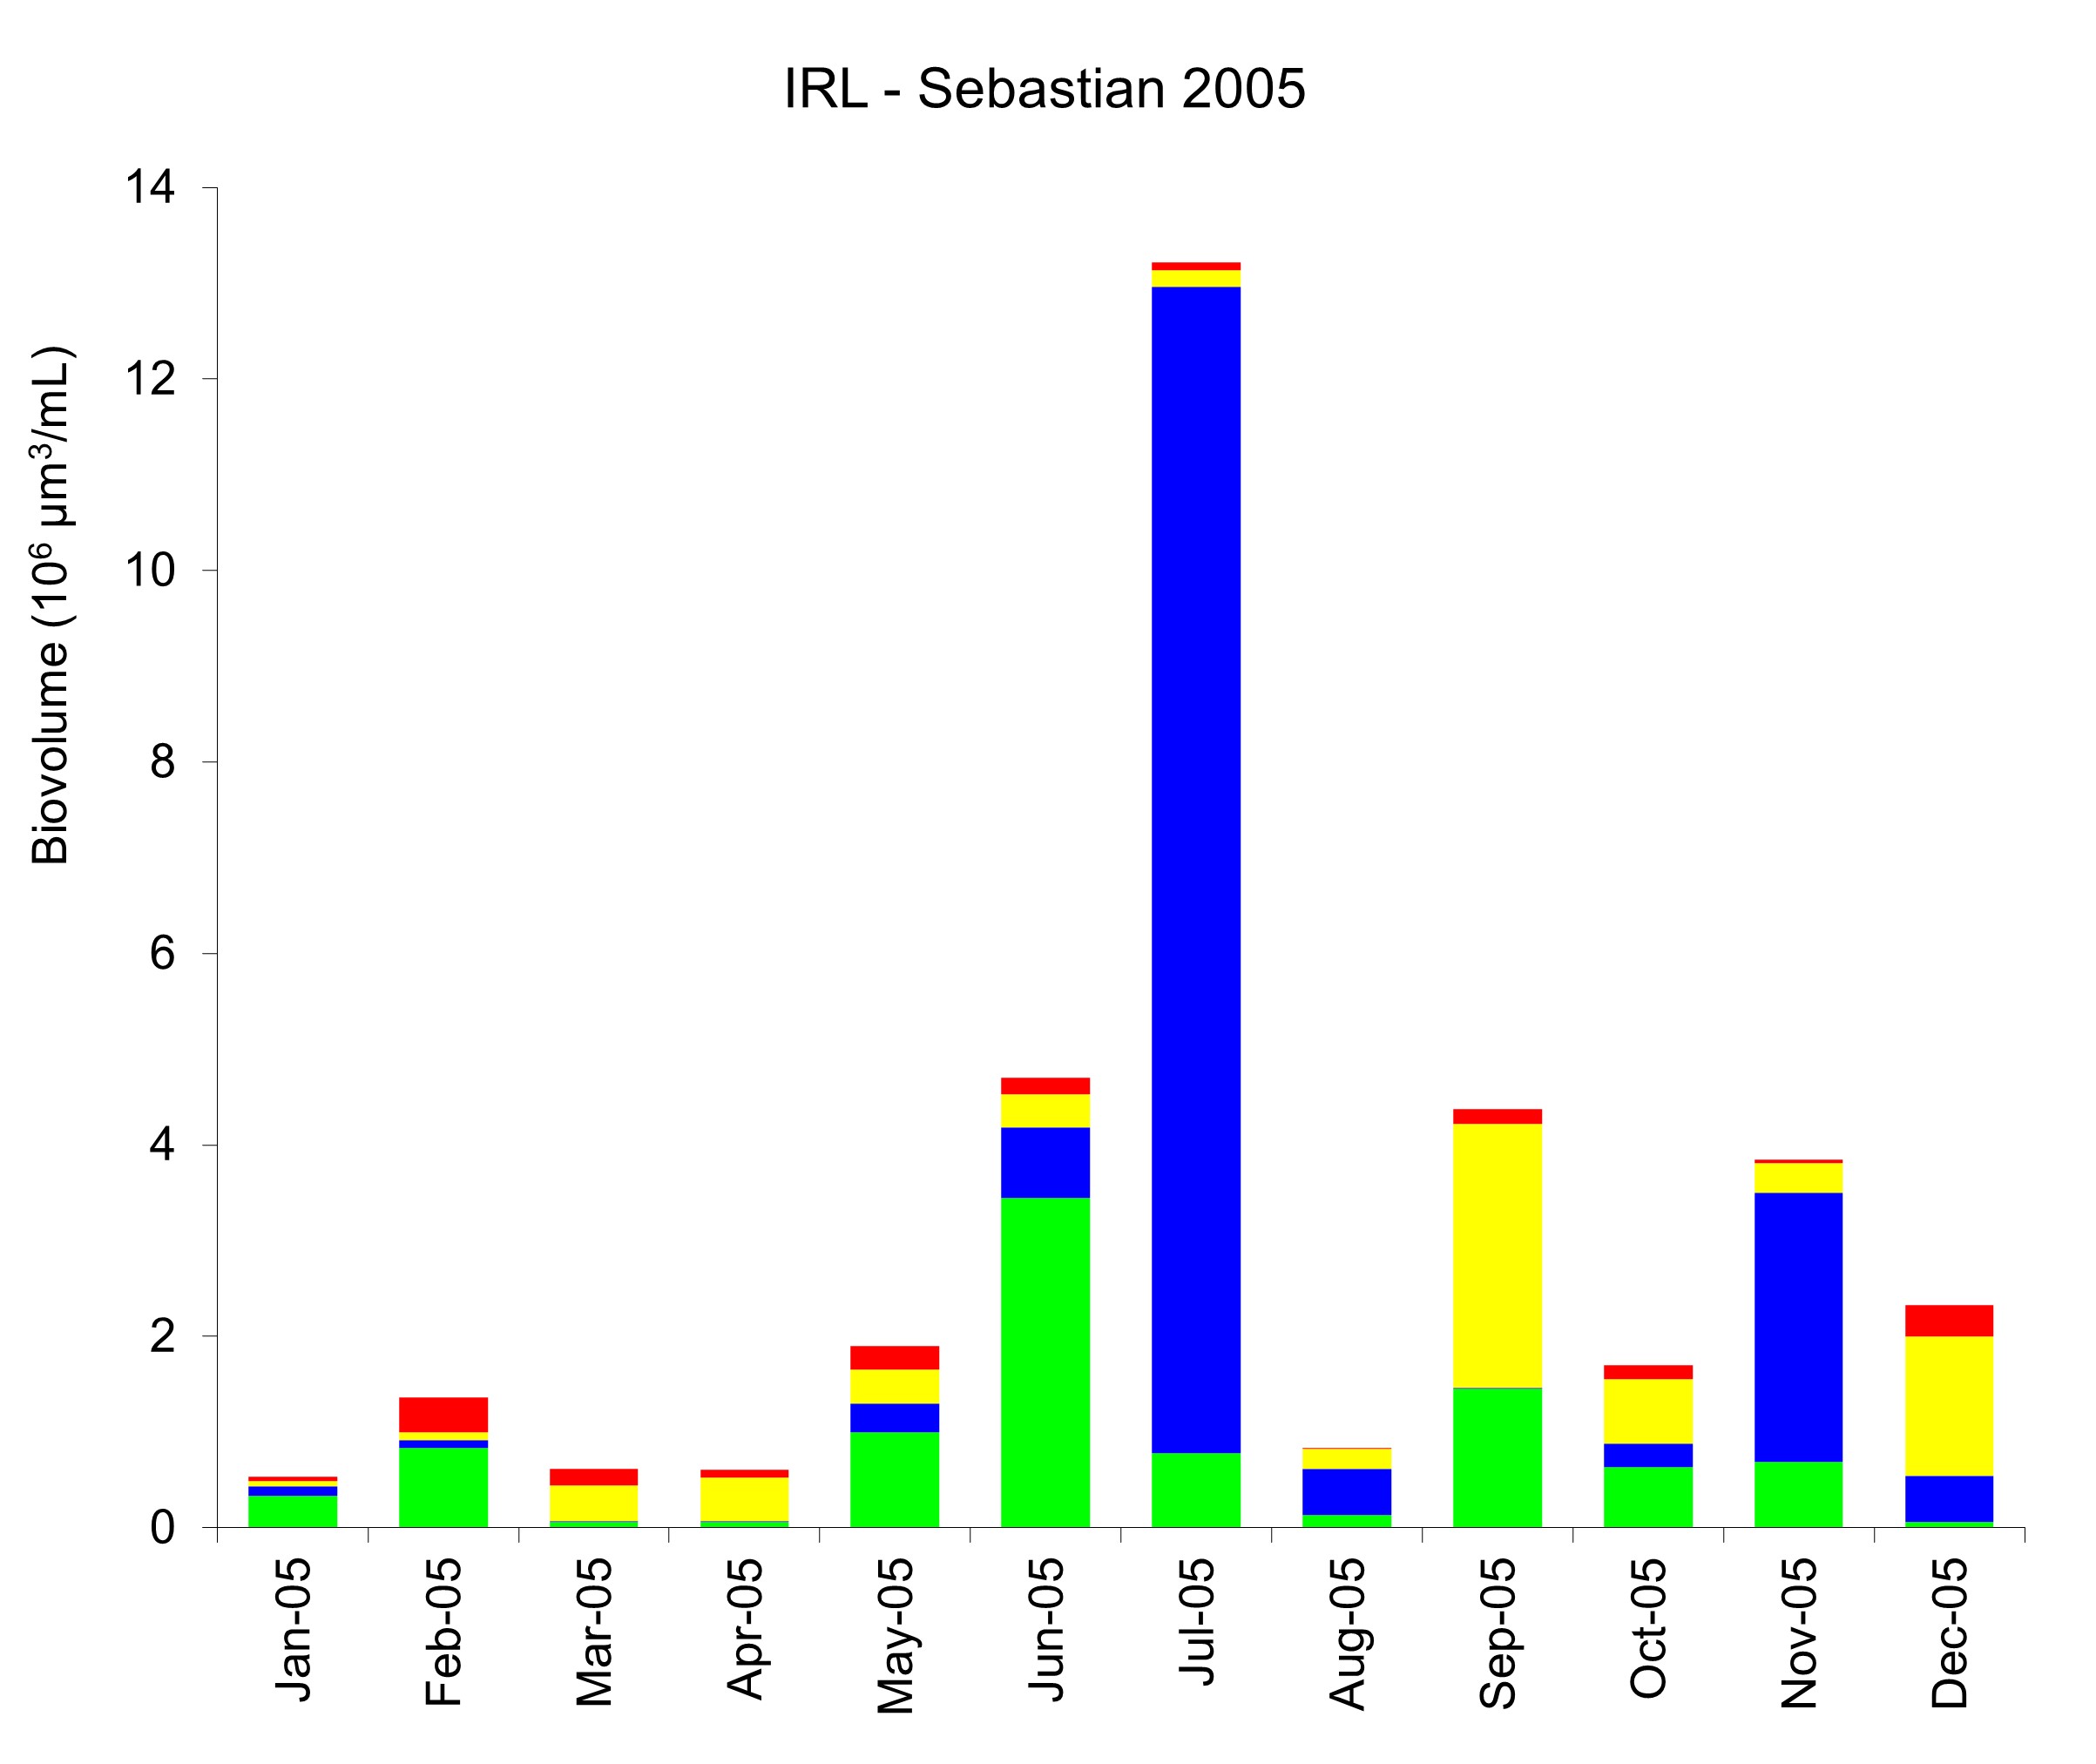
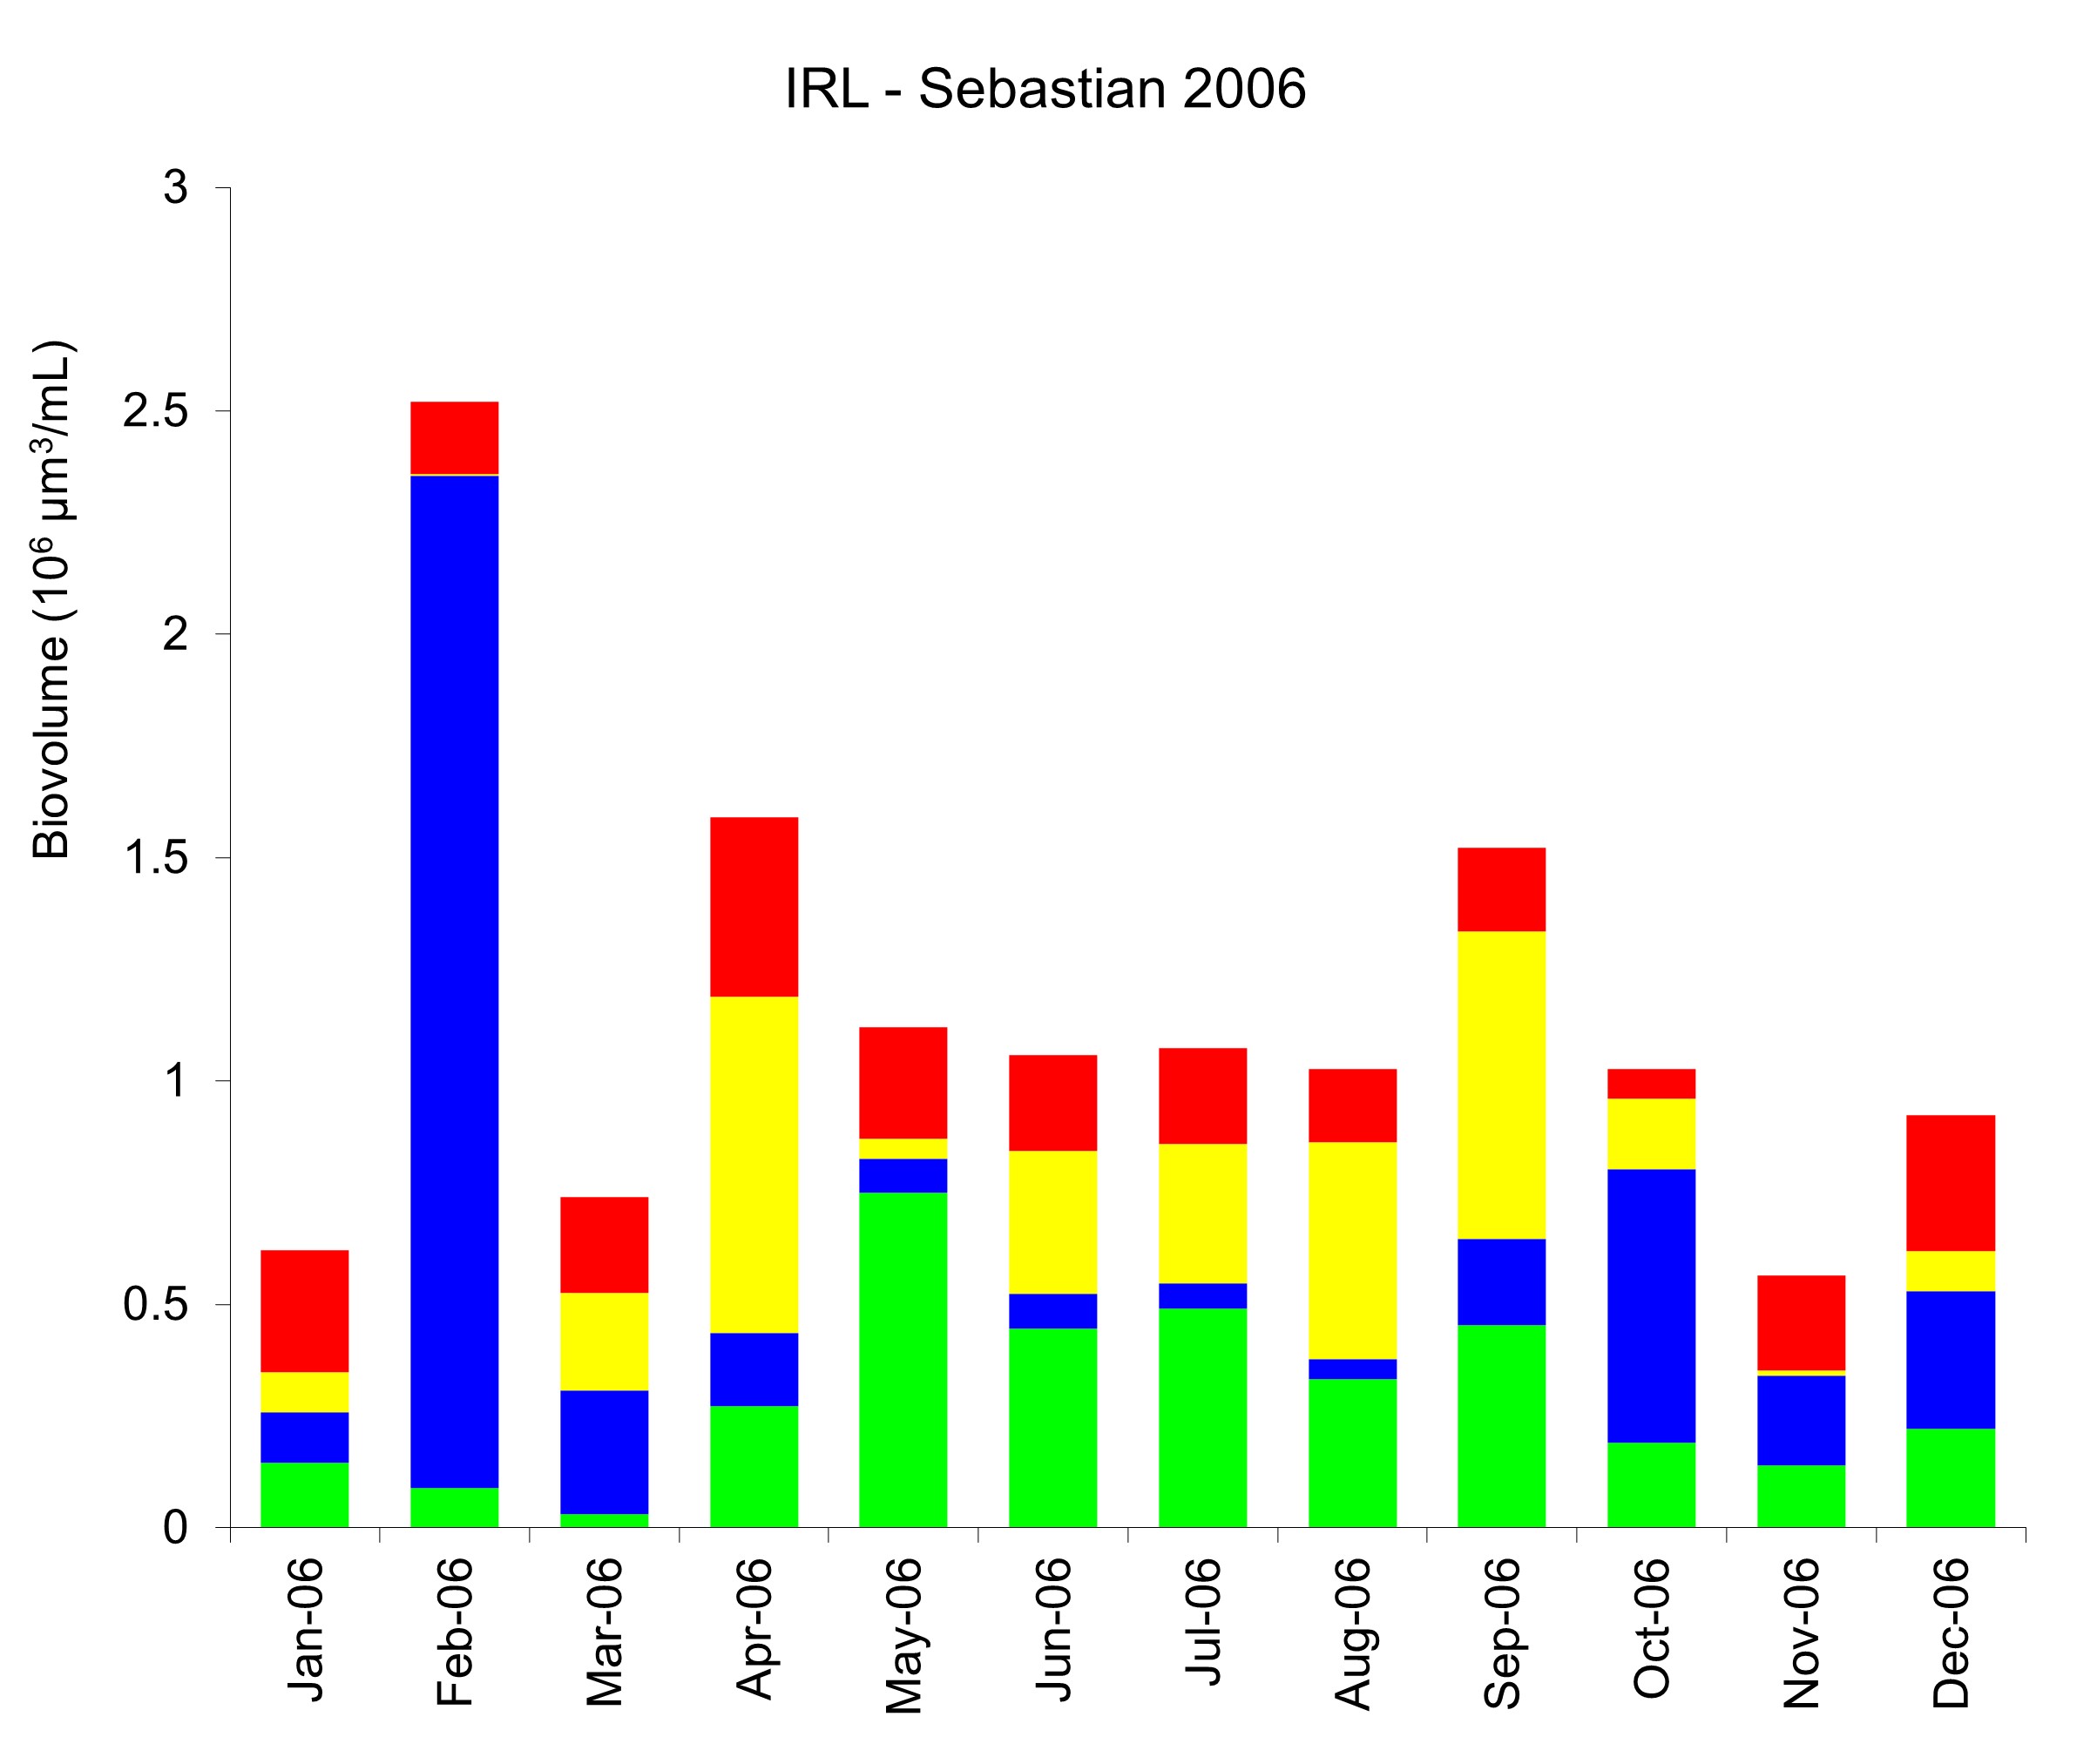
Phytoplankton Biomass Patterns
Below you will find graphs depicting biomass patterns for the Indian River Lagoon and Suwannee Sound regions of Florida. Each graph illustrates the composition of four major groups of phytoplankton. Click within the legends of the graphs for descriptions and example species from each algal group. Biomass was measured in units of biovolume (1 million cubic micrometers per milliliter, which is roughly equivalent to 0.001 grams per liter). Be sure to pay close attention to the scales of each graph. The y-axis changes depending on the range of values being shown.
.jpg)
.jpg)
.jpg)
.jpg)
.jpg)
.jpg)