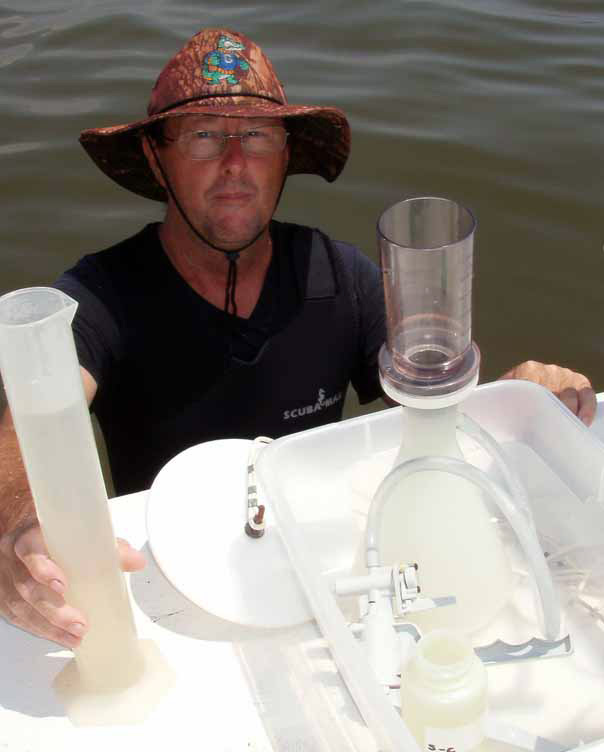
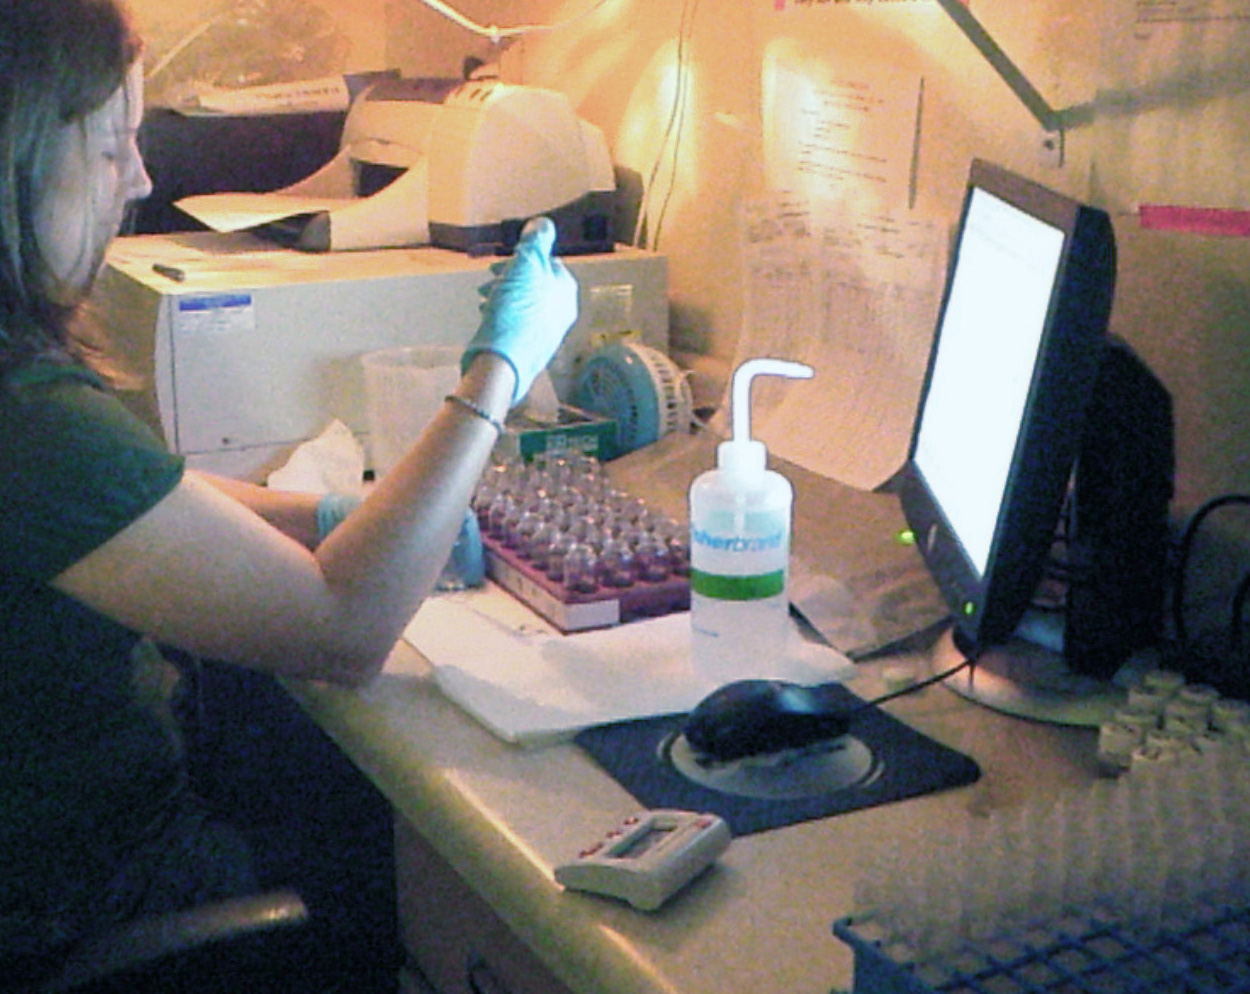
Microscopic counting of phytoplankton is the ideal way to investigate food availability in water samples, but this method is expensive and time-consuming. An indirect method for determining phytoplankton biomass (and food availability) is by estimation of chlorophyll a concentration. Chlorophyll a is a photosynthetic pigment contained in all algal cells. One method of determining chlorophyll a concentration is to filter water samples and then extract the pigment from the filters for subsequent determination of chlorophyll a concentration using a spectrophotometer (a device that measures light absorption at particular wavelengths).
Chlorophyll a concentrations can range from less than 1 to over 300 mg/m3 (or μg/liter). Chlorophyll a values are widely used to define the ‘trophic state’ of aquatic environments. ‘Trophic state’ is a measure of primary productivity (i.e., growth of algae). The specific chlorophyll a values associated with unproductive (oligotrophic), moderately productive (mesotrophic), highly productive (eutrophic), and extremely productive (hypereutrophic) ecosystems are only loosely defined for the marine environment, unlike the freshwater environment where rather specific definitions are available. The boundary values for the four productivity levels are roughly defined as 5, 10, 20, and 40 mg /m3 of chlorophyll a. Care must be taken in interpreting these thresholds since their meaning can be affected or confused by extraneous factors. For example, in highly flushed ecosystems these boundary levels could be lower, while in ecosystems with very low flushing rates the boundary levels might be set higher.
Many scientists view eutrophic and hypereutrophic conditions as undesirable, but such conclusions often depend on the specific issues under consideration. Whether a condition is considered good or bad is often in the eye of the beholder. For example, eutrophic conditions may enhance clam production so long as the phytoplankton involved are not harmful. In contrast, similar conditions may be unfavorable from a recreational perspective due to reduced water clarity.
Chlorophyll a Patterns
Below you will find graphs depicting chlorophyll a patterns for the Indian River Lagoon and Suwannee Sound regions of Florida. Be sure to pay attention to the scales of each graph. The y-axis may change depending on the range of values being shown.
.jpg)
.jpg)
.jpg)
.jpg)
.jpg)
.jpg)
.jpg)