
An Explanation of Data Available at http://www.freshfromflorida.com/Divisions-Offices/Aquaculture
At the top of the web page are tabs for the monitoring stations. Note the “Time of Collection” to see how recent the data are for that particular station. If the information is more than two hours old, try reloading or refreshing the page.
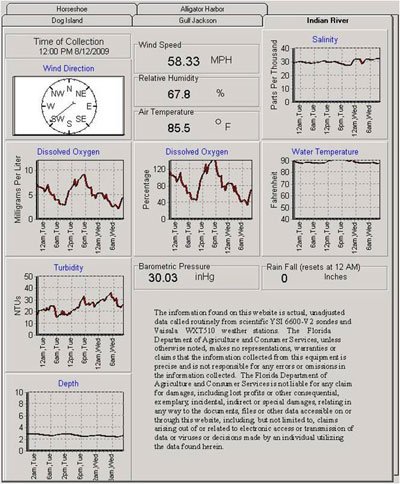
The top left of the web page is set-up to display weather data. However, wind direction and speed, relative humidity, air temperature, barometric pressure, and rainfall are no longer monitored. The graphs for salinity, dissolved oxygen, water temperature, turbidity, and depth have a similar orientation. The left-hand (vertical) axis on each graph shows the units of measure by the probe. The lower (horizontal) axis shows time. The graphs only display the most recent 36 hours of data. Make note of the disclaimer in the lower right of the web page.