A Microsoft Excel spreadsheet model was developed to assist grower in determining the effect of employing either a weekly, every other week, or every three weeks air drying routine. Models were developed for each state based on the biological results of the study.
To access the Economic Model Calculator click here.
The link will direct you to a Microsoft Excel file download. Once the file is opened in Excel, click on the “Enable Editing” button in the Protected View heading. Next, click on the “Enable Content” button in the Security Warning heading. Once you have opened the spreadsheet choose the tab that corresponds to the state where your farm is located.
Assumptions made in the Final Regional Project Report pertaining to oyster farm operations and directions for using the Economic Model Calculator can be found below. It is important to keep in mind that these models represent a study conducted at one site in each state. Each state and even each waterbody can have its own characteristics and differences in fouling. The information presented in the Economic Model Calculator is a reflection of experiences with this study and it should not be assumed the experience will be the same at every site. It does, however, aid the thought process on factors to consider when employing an air-drying routine to control biofouling in the Southern United States.
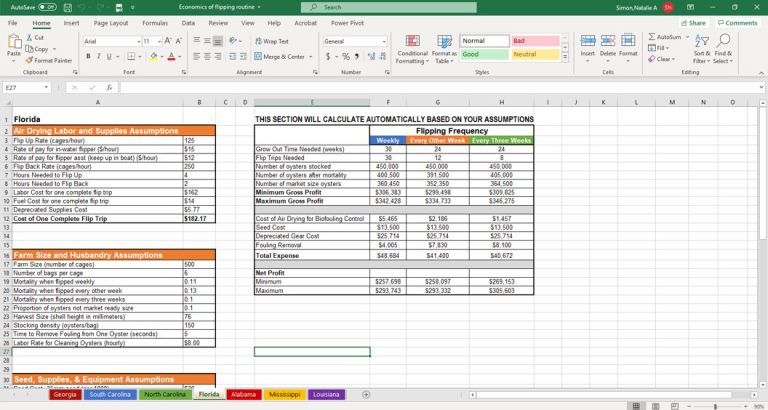
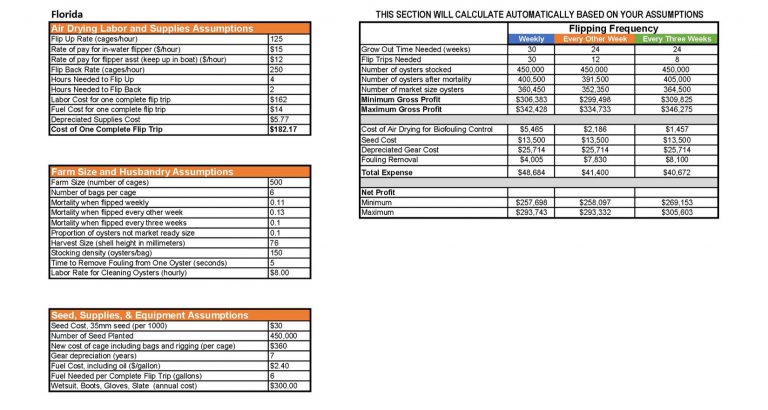
Understanding the Model’s Assumptions – The input side of the sheet
Air Drying Labor and Supplies Assumptions
The flip up and flip back rate are based on one, in the water person and one person assisting by shuttling that person from one line/location to the next. Labor arrangements and how flipping is accomplished will differ based on the physical capabilities of the grower, location, water depth, etc. The rows for flipping rate and labor cost allow for two people and should accommodate any arrangement because, generally, flipping can be accomplished by a two person team. Cells B3, B4, B5, and B6 can be manipulated based on the grower’s preference. Cells B7-B12 calculate automatically and should not be modified.
Farm Size and Husbandry Assumptions
All of the cells in this section can be modified based on the grower’s specific farm set up or preferences. The mortality rates are expressed in a proportion, simply multiply by 100 to envision percentage. Mortality is based on what was experienced during the experiment in each state. The proportion of oysters not market ready size represents the number of oysters in the bag that will not be 76 mm (3 inches) in shell height. The ‘Grow Out Time Needed’ in the table on the right hand side of the sheet has been set to be able to achieve this 10% target.
Seed, Supplies, and Equipment Assumptions
All of the cells in this section can be modified based on the grower’s specific farm set up or preferences. Fuel needs are based on the distance travelled to the farm site used during the experiment. We have not included the cost of a boat or other major equipment that would be part of the farm as that differs from one operation to another. In some cases, a boat may not even be necessary depending on the site.
Sale Price
Here a grower can set the minimum and maximum price he/she believe their oysters can be sold for. For the purposes of generating the model we selected two values which are current prices being achieved for the quality of oyster produced during the experiment.
Understanding the Model Output
The model output is the table located on the right-hand side of the spreadsheet. The numbers contained in the output will calculate automatically based on the assumptions you enter on the left-hand side of the spreadsheet. The top row of the output, labeled ‘Grow Out Time Needed’ reflects the time it took for the oysters in our experiment to reach 76 mm (3 inches). Also taken into consideration here is the time required for 90% of the oysters in the bag to be market-ready when that bag is harvested. This is an important consideration for a grower as it reduces labor costs associated with sorting and returning sub-market sized oysters back to sea. The ‘Grow Out Time Needed’ reflects the time needed for the oyster to grow from 35 mm to 76 mm. It considers ONLY the final grow-out stage. As a grower, you will need to add in expenses associated with the nursery stages of your farm. Some of the states involved in the experiment experienced a high degree of fouling which would require cleaning the oysters prior to sending them to market. As the authors, we made the assumption that these oysters would enter into the premium half-shell market and thereby be required to be relatively devoid of biofouling. The assumption was made that this cleaning would happen by hand, a gentler process, since mechanical manipulation of the oyster immediately prior to harvest can impact shelf life. We recognize a grower may have other venues for fouled product that would not require it to be cleaned. Certainly, this row can be manipulated by the grower to reflect his/her farm/processing/marketing arrangements.