Home » Other Oyster Culture Projects » ADDRESSING OYSTER MORTALITIES IN FLORIDA’S OFF-BOTTOM OYSTER AQUACULTURE INDUSTRY

Home » Other Oyster Culture Projects » ADDRESSING OYSTER MORTALITIES IN FLORIDA’S OFF-BOTTOM OYSTER AQUACULTURE INDUSTRY
The new off-bottom oyster aquaculture industry in Florida faces many challenges, such as limited seed availability and year-round need for biofouling control. Risks, such as storms and hurricanes, and economic feasibility are still being assessed. This pilot study addresses recent unexplained oyster mortalities experienced by growers in late spring and early summer, with reported losses of 50 to 90% of adult oysters reaching market size. This is not just a Florida issue but a problem facing growers in the Gulf of Mexico and Southeastern US.
Discussion concerning these mortality events began at a Florida oyster growers’ meeting in 2020. Although consensus was not reached about probable causes, there was agreement that a systematic approach was needed to better understand factors. This was followed by a Gulf of Mexico regional workshop where experts from several universities discussed what is known and not known. Industry input was sought to develop priorities for future work.
With University of Florida funding, a monitoring and assessment plan was initiated to examine relationships between production and health of cultured oysters and key environmental factors. The objectives were three-fold: monitor production at commercial farms; examine water quality parameters and phytoplankton abundance; and assess prevalence and severity of shell parasitism and Dermo disease.
Methods:
Four farms in two aquaculture use zones were identified in be involved in the study – two in Alligator Harbor in Franklin County and two at Oyster Bay in Wakulla County. Oysters were spawned at the Auburn University Shellfish Lab in May 2020. Two triploid lines were produced using males from the traditional LSU tetraploid stocks and the newly developed Florida tetraploids. These were half-siblings with shared diploid females. This provided an opportunity to evaluate the performance of two genetic lines. Seed were nursed by UF at Cedar Key to a size (R6) that is typically purchased by growers for planting. Seed were distributed on September 29, 2020, with about 1,000 of each line given to growers. Average seed size was 21 mm for Florida and 19 mm for Louisiana, both averaged 1.4 grams in weight. Seed were deployed into Vexar bags supported by floats. Growers maintained oysters during the culture period.
Sampling was initiated in late January 2021, 4 months post-deployment. Bimonthly sampling was undertaken until most oysters reached market size. There were three sample periods for Alligator Harbor with harvest on May 25th, while Oyster Bay had four sample periods with harvest on July 13. Water temperature and salinity were continuously monitored using a YSI sonde at Alligator Harbor and Onset loggers at Oyster Bay. At each sample period, oysters were measured for shell height and whole wet weight and live and dead oysters counted per replicate bag. Phytoplankton kits were provided to a grower at each lease area to collect and preserve water samples weekly during March through July, months when mortalities have been observed. Two sets of samples were analyzed monthly at the UF Algal Ecology Lab. In addition, oysters collected from each sample period were analyzed for health at the UF Aquatic Pathobiology Lab.
Results:
Water temperatures were similar for both lease areas, declining throughout sample period 1, increasing in the following sample periods. Seasonal differences followed expected patterns (Figure 1). The growout period at Oyster Bay extended into June and July with monthly average values reaching 83°F. At Alligator Harbor, salinity was high with little variation as sample period averages ranged from 28.3 to 30.7 (Figure 2). Lower salinities were observed at Oyster Bay as the site is influenced by adjacent rivers and seasonal variations due to run-off and prevailing winds. Sample period averages ranged from 17.8 over the summer months to 23.1 in the winter.
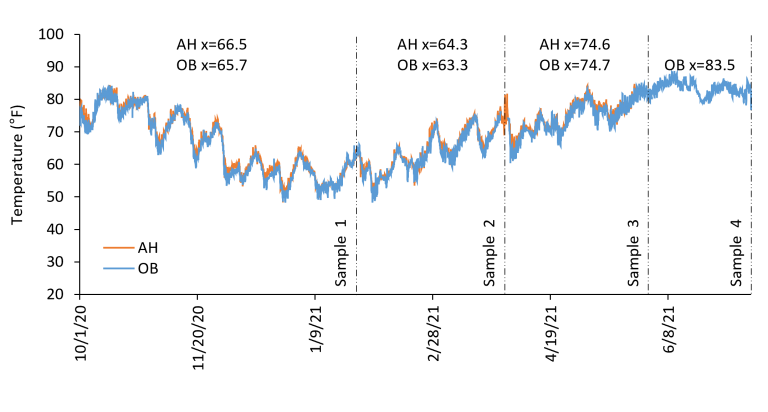
Figure 1. Continuous water temperature (°F) data from October 1, 2020, to May 25, 2021, at the Alligator Harbor (AH) lease location and from October 1, 2020, to July 13, 2021, at the Oyster Bay (OB) lease location. Means for each sample period are displayed.
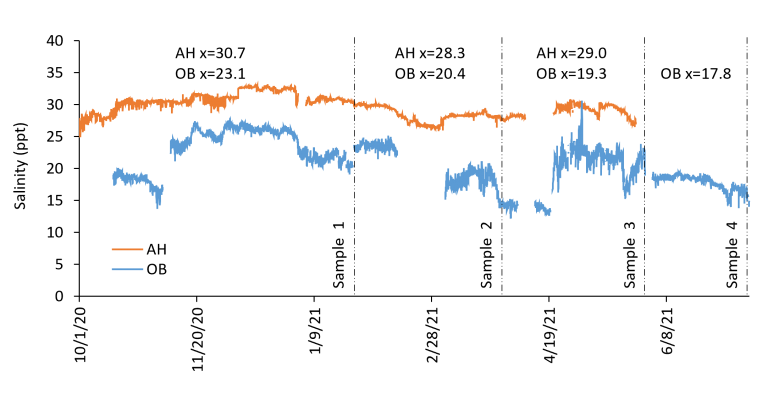
Figure 2. Continuous water salinity (ppt) data from October 1, 2020, to May 25, 2021, at the Alligator Harbor (AH) lease location and from October 1, 2020, to July 13, 2021, at the Oyster Bay (OB) lease location. Means for each sample period are displayed.
Growth in terms of shell height is displayed in the following graph with AH results on the right and Oyster Bay on the left (Figure 3A). Orange bars represent the Florida stock and blue the Louisiana stock. At AH, oysters reached market size (for this study about 75 mm) in sample period 2 after six months but were allowed to continue to grow for another two months to observe performance under higher temperatures, whereas it took an additional 3.4 months for oysters at OB to reach market size. Greatest growth was observed at AH over the first sample period as temperatures declined, whereas greatest growth occurred during the third sample period at OB. Although FL triploids were larger than LA triploids for each sample period and at both locations, differences were not significant. Average weight of harvest sized oysters at AH was 39 grams at 6 months but doubled in weight after an additional two months (Figure 3B). The greatest weight gain at OB was also observed over the period with warmest water temperatures as oysters reached harvest size. Values differed significantly between triploid lines during sample periods 3&4 at Oyster Bay, suggesting responses under more favorable environmental conditions, such as lower salinities, may be population dependent.
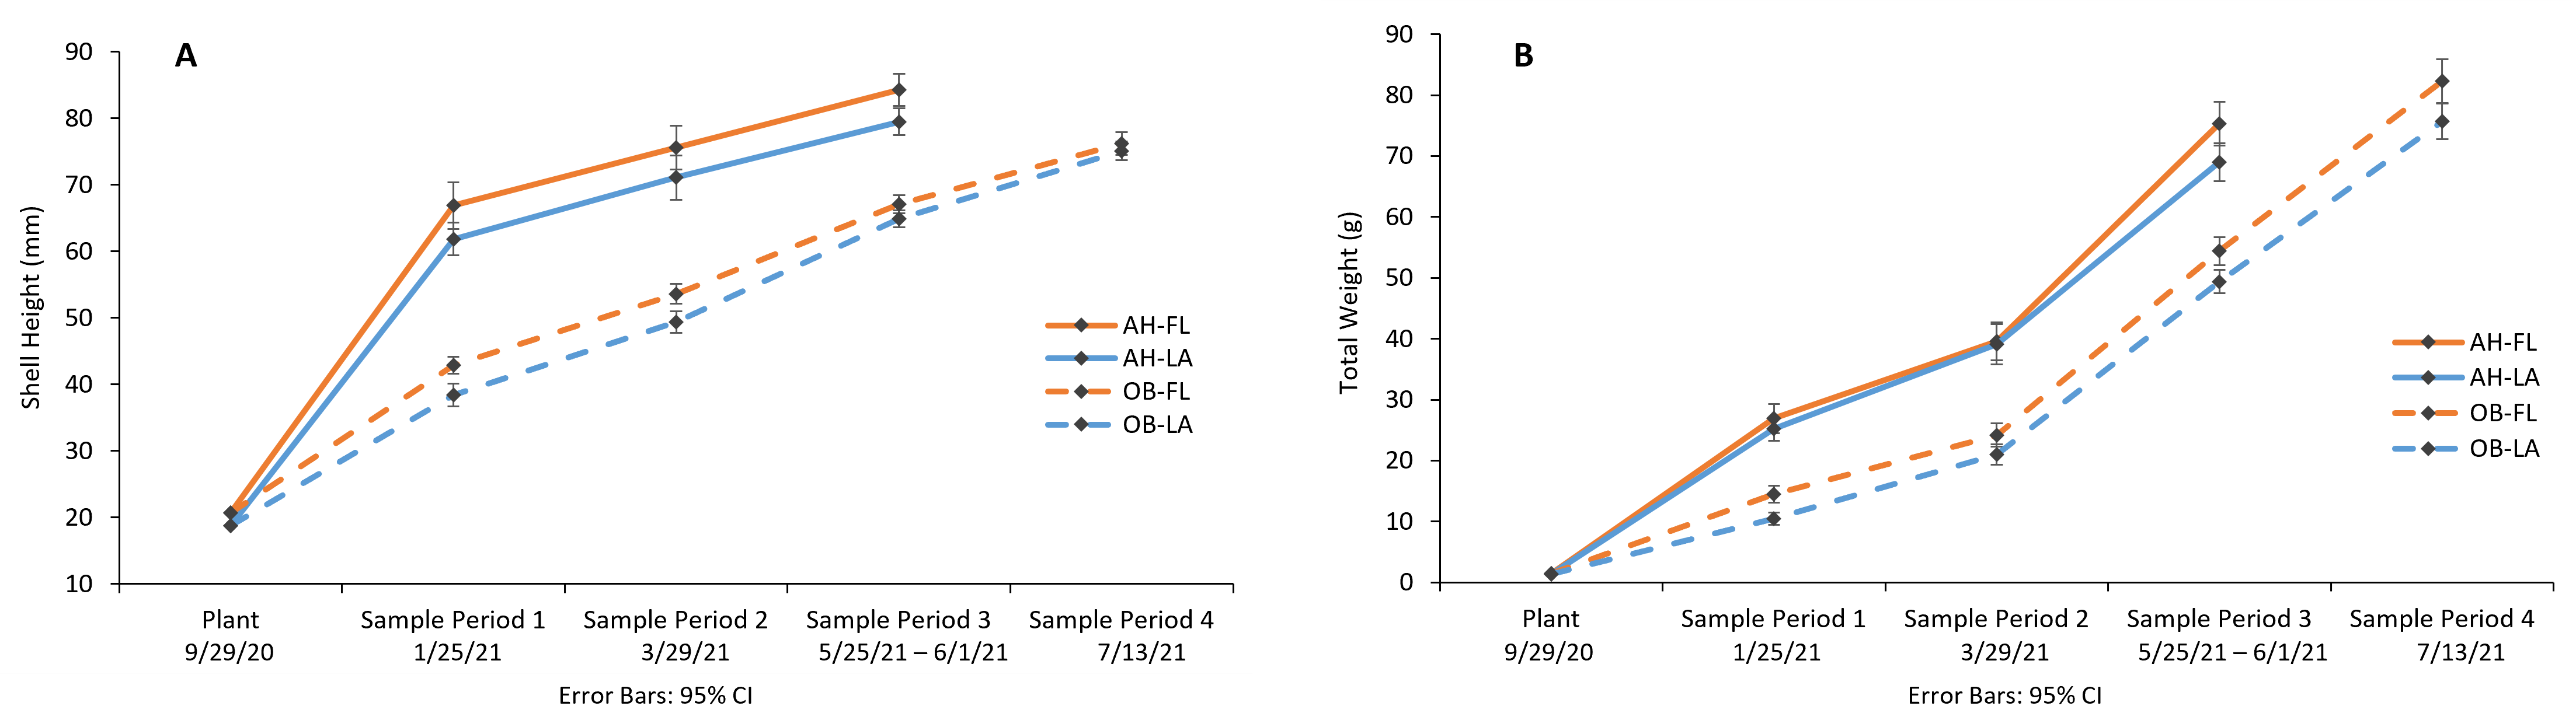
Figure 3. (A) Average shell height (mm), (B) Average whole wet weight (grams) of Florida (FL) and Louisiana (LA) triploid oysters from plant to harvest at farms located at the Alligator Harbor (AH) and Oyster Bay (OB) lease locations. Error bars denote 95% confidence intervals.
In the next graph, interval mortality is displayed as bars and cumulative mortality as lines (Figure 4). Mortality was negligible (<2%) in sample periods 1&2 for both stocks and locations. However, over the next two months, mortalities at AH increased to 28-31% as temperatures increased. During this period, some growers at AH reported high mortalities. At OB, interval mortalities increased to 8-12% at the end of May (SP3), and doubled in the next sample period, resulting in a cumulative mortality of 25% for the FL line and 40% for the LA line, resulting in notable genetic stock differences.

Figure 4. Interval and cumulative mortalities of Florida (FL) and Louisiana (LA) triploid oysters from plant to harvest at farms located at the Alligator Harbor (AH) and Oyster Bay (OB) lease locations. Error bars denote 95% confidence intervals.
Results of phytoplankton monitoring during the spring revealed a total biomass of 590 µg carbon/L at AH, which was 4.5 times higher than that at OB. Dinoflagellate peaks were dominated by five species, but biomass values were below those associated with harmful algal blooms in other ecosystems. Diatoms were the major species and contributed 61% of the biomass at AH and 39% at OB. Diatoms are considered positive features in coastal food webs. Other taxa were dominated by nanoplanktonic species. Looking at the prevalence of Polydora (mudworm) across locations and stocks, observations of excavations, tubes and/or blisters increased from 57% in the first sample period to 81% in the last. Infection severity was, on average, mild with scores ranging from 0.4 to 0.9 throughout the study out of a scale of 5. Both visual assessments increased with size and age of the oysters. Weighted prevalence of Dermo (Perkinsus marinus) was calculated from prevalence (present or not) and severity and scored on a scale of 0 to 5. Average values across locations and stocks were less than 1, which is considered a mild infection. Differences in stocks varied by sample period but not significantly.
Summary:
“Sentinel” farms were established at two locations to begin examining relationships between production, health, and environmental variables. Shell growth rates were significantly affected by sample period (SP), location, and their interaction. At AH, rate in SP1 was 1.6–2.7 times higher than other periods and OB. During SP2&3, rates were higher at OB compared to AH. Salinity influenced growth with no effect from temperature, health indices or stock.
AH had higher weight growth rates compared to OB, this effect was greater in SP3 versus SP1&2. Rates increased significantly at OB in SP3&4, effect was 3-5 times greater than differences between locations. Higher temperatures and salinities affected weight gain. Stock also influenced weight gain with FL triploids at OB having significantly higher rates than LA triploids during SP3&4.
Mortality rates increased considerably in SP3&4; SP was the strongest effect observed. OB had lower overall mortality than AH with a significant interaction between location and sample period. Higher salinities and temperatures influenced mortality. Dermo was significantly higher in SP4 than any other SP but did not demonstrate any patterns related to mortality; there were no effects from Polydora on mortality. Florida triploids demonstrated lower mortality than Louisiana triploids. Mortality differences between genetic stocks indicate potential to develop a line with higher resistance to environmental stressors and mortality events.
For more information on project results, view the final report here.
Investigators:
Leslie Sturmer, UF/IFAS Extension
Andrew Kane, UF Department of Environmental and Global Health, Florida Sea Grant
Ed Phlips, UF/IFAS School of Forest, Fisheries, and Geomatic Sciences (SFFGS)
Erik Lovestrand, UF/IFAS Florida Sea Grant Extension
Natalie Anderson, UF/IFAS Extension and SFFGS
Holden Harris, UF/IFAS Nature Coast Biological Station
Funding:
UF/IFAS Support for Emerging Enterprise Development Integration Teams (SEEDIT) Program, 2020-1