
Home » Other Oyster Culture Projects » Comparison of Stocking Densities for Floating Bag Oyster Culture
A prior field study conducted in 2016-17 documented the effects of ploidy, stocking density, and float design on oyster production. No significant differences in growth or survival of diploid and triploid oysters cultured at three densities (125, 150, and 175/bag) were found. In this study, higher stocking densities ranging from 175 to 250 oysters per floating bag were examined. The objectives were two-fold: 1) evaluate the performance of triploid eastern oysters using four stocking densities and 2) document the effects of biofouling on oysters and gear in southern growing conditions.
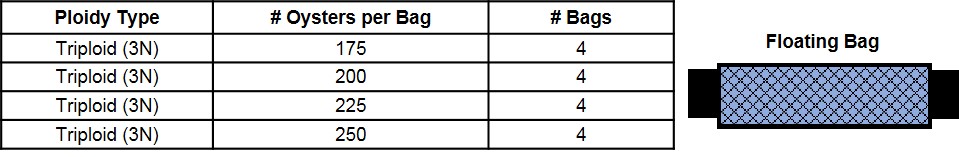
In June 2018, triploid oysters were spawned at a commercial hatchery in Cedar Key and nursed for four months until deployment in mid-October at the UF experimental lease within the Dog Island Aquaculture Use Area off Cedar Key. At the time of deployment, triploid oysters were 41 mm in shell height (SH), 26 mm in shell length (SL), and 13 mm in shell width (SW). Oysters were stocked into 14 mm mesh Vexar bags supported by two 4½” square floats at the following densities: 175, 200, 225, and 250 per bag (Table 1). Each density treatment was replicated in four bags. Bags were flipped on a weekly basis allowing one side of the bag to aerial dry to control biofouling organisms.
Table 1. Summary of study evaluating stocking densities in final culture bag.
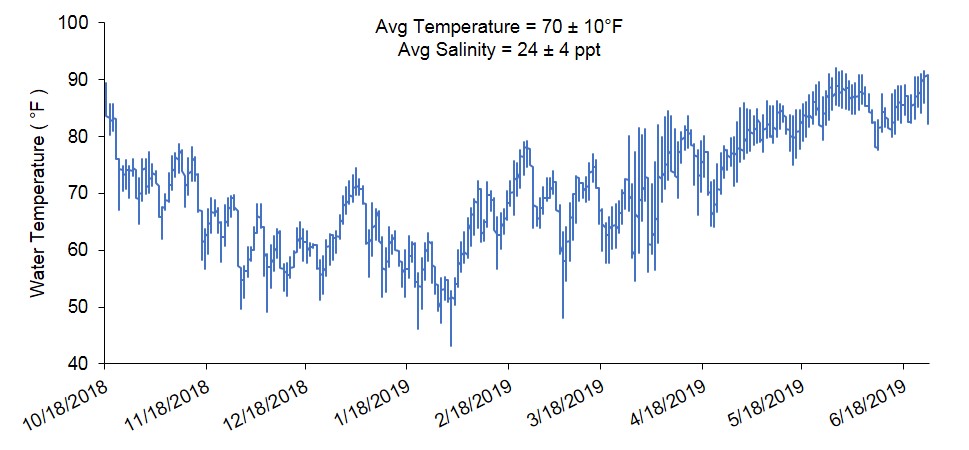
Oysters were harvested after 8.5 months in June 2019. Water temperatures from October through June averaged 70 °F and salinities averaged 24 ppt (Figure 2). Upon harvest, survival was determined by counting the number of live oysters per bag and dividing by oysters stocked (n=175, 200, 225, 250). Growth was determined by measuring all live oyster from each bag for shell height, length, width, and total weight. In addition, 25 of these oysters were frozen for later analyses of wet and dry meat weights, condition index, and biofouling. Pictures were taken to document appearance of external and internal shells as well as meats. In addition, the accumulation of biofouling on oysters and gear for each treatment was quantified. These data were statistically analyzed to determine the effects of stocking densities and considered significant when probability values (p) were less than 0.05.
Figure 2. Water temperatures recorded from October 2018 through June 2019 in Cedar Key, Florida.
Results: Survival, Growth, Condition Index
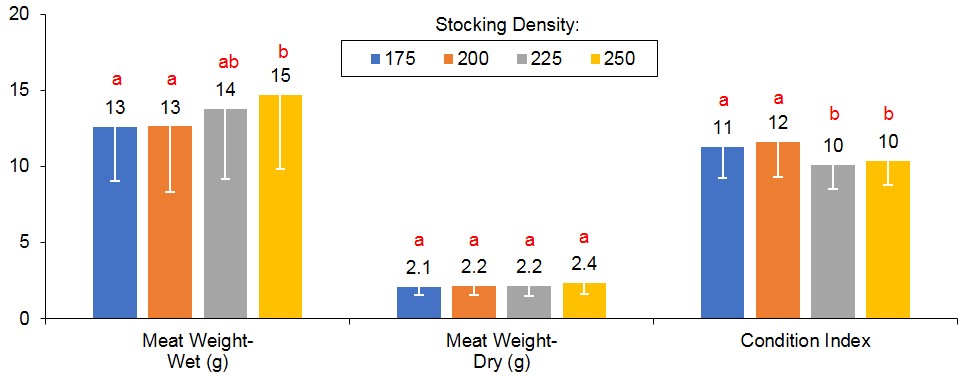
At harvest, survival was similar for oysters stocked at 175 (82%), 200 (82%), 225 (81%), and 250 (84%) per bag (Figure 3). However, oysters stocked at 225 and 250 per bag had slightly higher shell heights (SH, 76-77 mm) and shell lengths (SL, 53-54 mm) compared to oysters stocked at 175 and 200 per bag (SH, 70 mm; SL 50 mm). Oysters in all stocking density treatments exhibited similar shell widths (29 mm). Higher total weights and wet meat weights were observed in oysters stocked at 225 and 250 per bag (TW, 85-88 grams, g; MW, 14-15 g) compared to oysters stocked at 175 and 200 per bag (TW, 74 g; MW, 13 g) (Figure 4). Oysters stocked at all densities had similar dry meat weights (2.1-2.4 g). Interestingly, condition index was higher in stocking densities of 175 and 200 (11.3-11.6) compared to 225 and 250 oysters per bag (10.1-10.3). Condition index is a weight ratio that describes meat yield, in terms of dry meat weight, total wet weight, and dry shell weight (equation below).
Figure 3. Shell height, shell length, and survival results for oysters cultured in floating gear at different stocking densities per bag. Values with different letters indicate significant differences (p<0.5) among treatments.
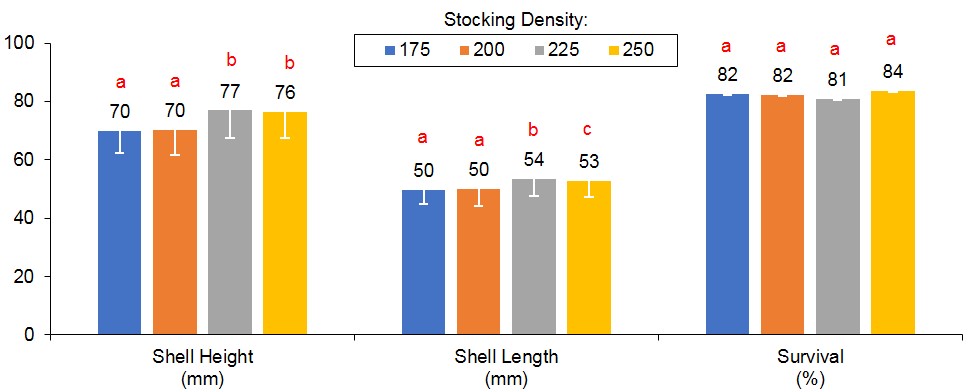
Figure 4. Meat weight (wet and dry) and condition index results for oysters cultured in floating gear at different stocking densities per bag. Values with different letters indicate significant differences (p<0.5) among treatments.
Results: Appearance
The appearance of oyster meats from bags stocked at varying densities are shown in Figure 5. Shell measurements (height, length, width) are used to calculate fan and cup ratios to determine if the external shell shape is appealing for the half-shell market. Fan ratio (FR) is calculated by dividing the shell length by shell height (SL/SH) and cup ratio (CR) is calculated by dividing shell width by shell height (SW/SH). Industry experts consider fan ratios above 0.66 and cup ratios above 0.33 to be favorable for oysters designated for the half shell market. Although oysters in all density treatments exceeded the preferred fan and cup ratios, ratios were higher at densities of 175 and 200 (FR, 0.71; CR, 0.42) compared to densities of 225 and 250 (FR, 0.69-0.70; CR, 0.38).
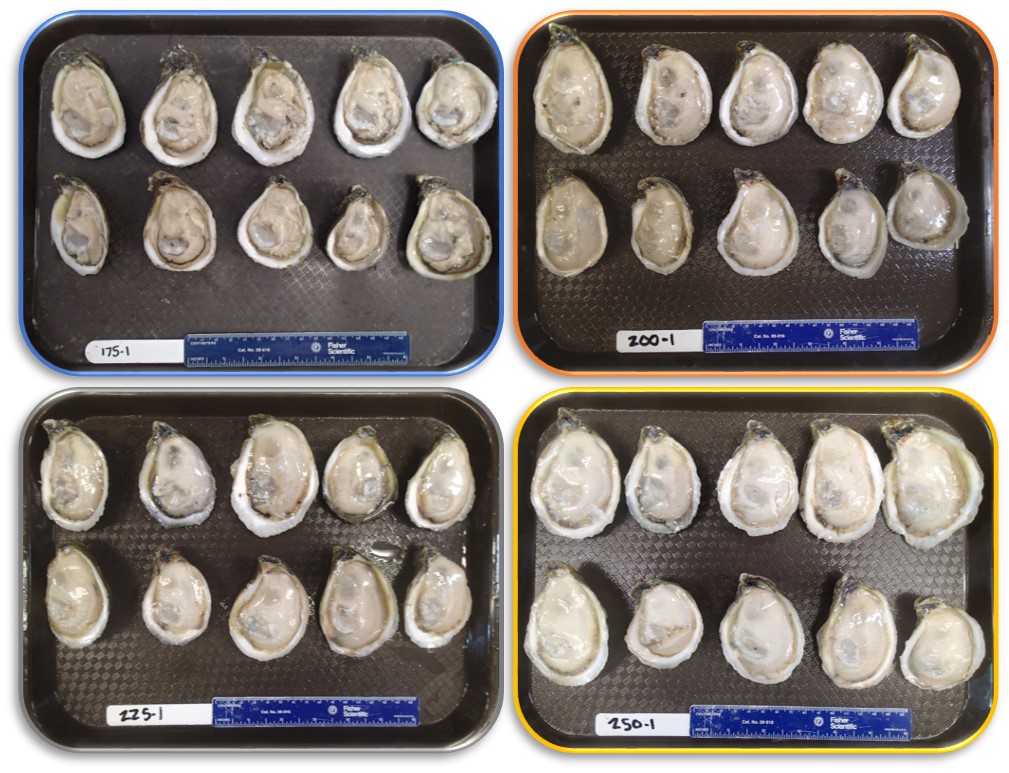
Figure 5. Appearance of oyster meats harvested from floating bags stocked at different densities.
Results: Biofouling Control
Biofouling on Oysters
This study was conducted from October 2018 to June 2019, which is considered a “winter” growout, as most of the culture period was over the cooler winter months. In Florida, the biofouling season is a problem during the warmer summer months when environmental conditions enable fast oyster growth as well as fast growth of fouling organisms. To quantify biofouling in this study, oysters were weighed before and after removal of all fouling organisms from the shells, then wet meat weights were subtracted from total weights to determine percentage of fouling weight (see equation below). Oysters stocked at 225 (2.8%) and 250 (2.3%) per bag had higher biofouling compared to oysters stocked at 175 (1.5%) and 200 (1.6%) per bag (Figure 6). Overall, biofouling was minimal; the predominant fouling organism was barnacles, followed by naturally occurring (“wild”) oyster spat (Figure 7).

Figure 6. Percent biofouling on oysters cultured in floating gear at different stocking densities per bag. Values with different letters indicate significant differences (p<0.5) among treatments.
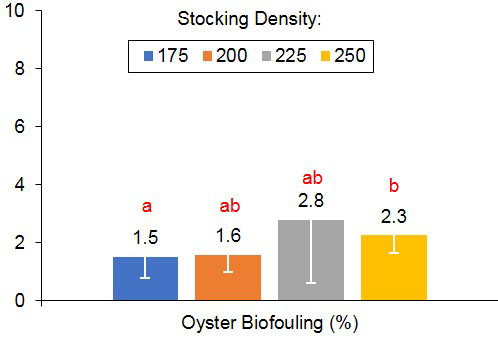
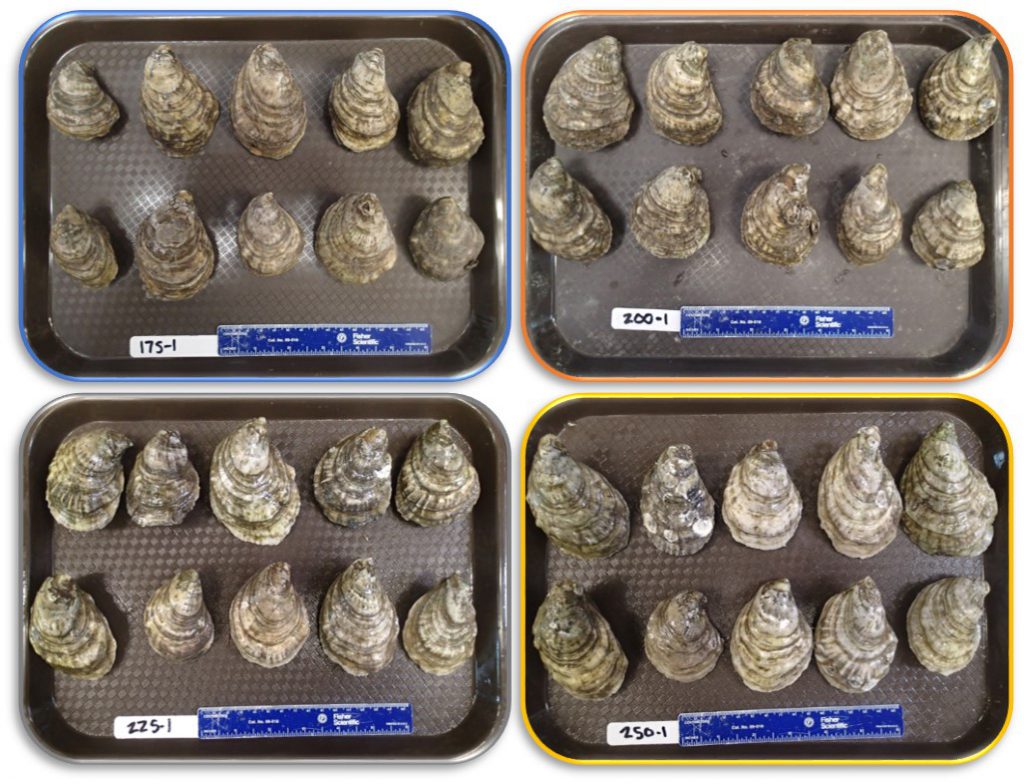
Figure 7. Biofouling on oysters harvested from floating culture gear stocked at different densities per bag.
Biofouling on Gear
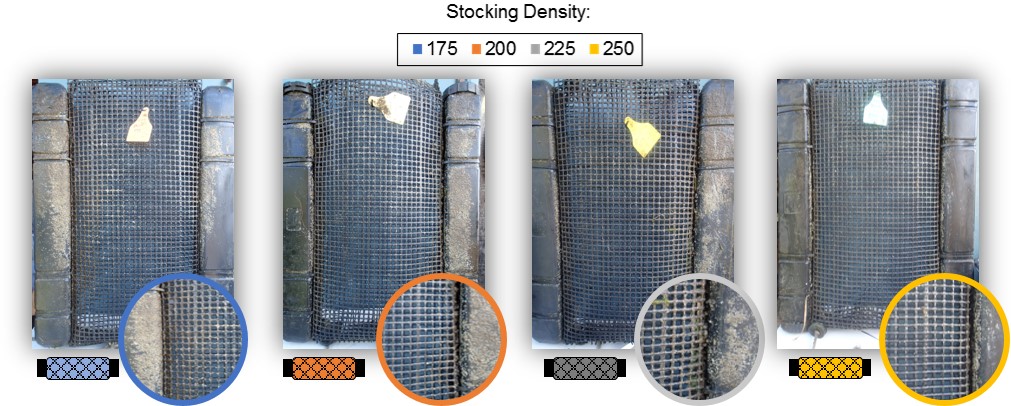
Biofouling accumulation on the culture gear was quantified by weighing bags and attached 4½” square floats immediately after harvest and subtracting the weight from the corresponding pre-deployment bag/float weights expressed as a percentage (see equation below). Stocking density did not have an effect on biofouling as accumulation was similar for both the lower density of 175 oysters per bag (24%, 2.1 lbs) and higher density of 250 per bag (24%, 2.2 lbs). Fouling percentage was slightly higher on gear stocked at 200 and 225 oysters per bag (26-27%). Again, the predominate fouling organism was barnacles, especially on the floats (Figure 8).

Figure 8. Biofouling on floating culture gear (bags and square floats) at harvest.
A summary of data generated from this study, including averages and standard deviations of variables measured, and probability (p) values for the Kruskai-Wallis and post-hoc Dunn’s statistical tests, can be found here.
Summary
In this study production of oysters in floating bags stocked at densities ranging from 175 to 250 oysters per bag was commercially acceptable. Although statistical differences were found among densities, growers most likely would not differentiate among values obtained for growth, weights, or conditions index. Interestingly, higher values were found at higher densities for shell height, shell length, and meat weight with lower values for condition index. In the study conducted during 2016-17, production was not significantly different for triploid oysters stocked at 125, 150 and 175 per floating bag. Growth (81-84 mm SH) and survival (89-91%) were higher in that study compared to this study, possibly related to annual environmental differences or seed variation. Although these results suggest that growers may stock as high as 250 oysters per bag, there are other things to consider. Increased bag weight places additional tension to lines and can result in fraying and breakage. Further, heavier bags can be problematic during inclement weather conditions and storms. There was no observed advantage in stocking densities pertaining to biofouling accumulation. However, it is likely at higher densities and increased bag weights that the gear could sink lower in the water and not be as effective in aerial drying. Control practices in this study were effective in reducing biofouling as most of the culture period was conducted during the cooler months but may not be during a summer growout period when biofouling is at its peak.