
Home » Other Oyster Culture Projects » Floating Gear Comparison for Off-bottom Oyster Culture
A study comparing floating gear for off-bottom oyster aquaculture was conducted with the following objectives: 1) document the production performance of triploid eastern oysters using two floating gear types and 2) evaluate the effects of biofouling control methods used in southern growing conditions. Similar objectives were addressed in a USDA Southern Regional Aquaculture Center (SRAC)-funded project that examined biofouling control regimes for floating cages, including various flipping regimes and a biocide-free, antifouling coating, in the northern Gulf of Mexico (LA, MS, AL, FL). Since Florida was one of the study sites, a comparison of floating cages with floating bags, which are used by many oyster growers in the state, was also evaluated.
Methods
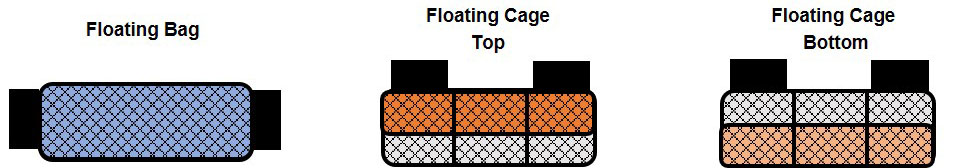
In June 2017, triploid oysters were spawned and nursed for four months at Louisiana Sea Grant’s oyster research lab until deployment in late September at UF’s experimental lease off Cedar Key. At the time of deployment, triploid oysters were 52 mm in shell height (SH), 39 mm in shell length (SL), and 16 mm in shell width (SW). Oysters were stocked into 14 mm mesh uncoated Vexar bags at a density of 150 per bag. Nine bags were supported with 4½” square floats (FB) attached to the sides of the bags (GoDeep). Twelve bags were placed inside six-slot floating cages (OysterGro®) as part of the SRAC study – seven bags placed on the top level of four cages (FC-T) and five on the bottom level of four cages (FC-B) (Table 1). The bag position (top versus bottom) was determined when the cage was fully submerged in the water (“growing” position) (Figure 1).
Table 1. Summary of study evaluating floating gear types.
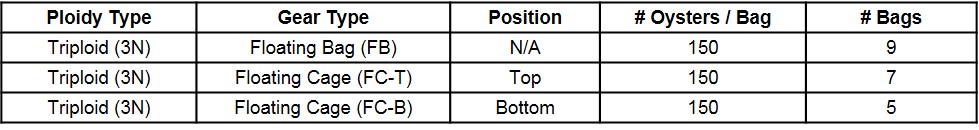
Figure 1. Two gear types and three treatments examined during an 8.5-month study.
A study comparing floating gear for off-bottom oyster aquaculture was conducted with the following objectives: 1) document the production performance of triploid eastern oysters using two floating gear types and 2) evaluate the effects of biofouling control methods used in southern growing conditions. Similar objectives were addressed in a USDA Southern Regional Aquaculture Center (SRAC)-funded project that examined biofouling control regimes for floating cages, including various flipping regimes and a biocide-free, antifouling coating, in the northern Gulf of Mexico (LA, MS, AL, FL). Since Florida was one of the study sites, a comparison of floating cages with floating bags, which are used by many oyster growers in the state, was also evaluated.
In June 2017, triploid oysters were spawned and nursed for four months at Louisiana Sea Grant’s oyster research lab until deployment in late September at UF’s experimental lease off Cedar Key. At the time of deployment, triploid oysters were 52 mm in shell height (SH), 39 mm in shell length (SL), and 16 mm in shell width (SW). Oysters were stocked into 14 mm mesh uncoated Vexar bags at a density of 150 per bag. Nine bags were supported with 4½” square floats (FB) attached to the sides of the bags (GoDeep). Twelve bags were placed inside six-slot floating cages (OysterGro®) as part of the SRAC study – seven bags placed on the top level of four cages (FC-T) and five on the bottom level of four cages (FC-B) (Table 1). The bag position (top versus bottom) was determined when the cage was fully submerged in the water (“growing” position) (Figure 1).
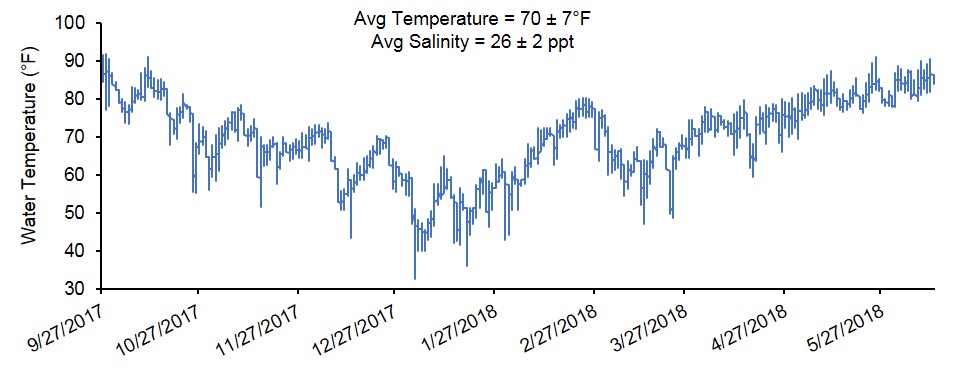
Figure 2. Water temperatures recorded from September 2017 through June 2018 in Cedar Key, Florida.
Results: Survival, Growth, Condition Index
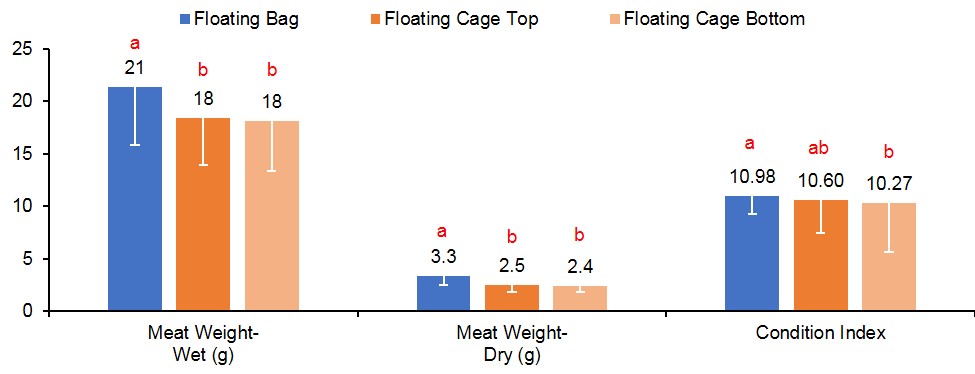
At harvest, survival was similar for oysters grown in FB (90%), FC-T (91%), and FC-B (86%) (Figure 3). However, oysters grown in FC-T bags had slightly higher shell heights (87 mm) compared to oysters in FB (84 mm) and FC-B (84 mm). The floating cages produced oysters with similar shell length regardless of bag placement (FC-T, 67 mm; FB-C, 66 mm), but were significantly larger than oysters in FB (59 mm). Oysters in all gear treatments exhibited similar shell widths (32-33 mm). Oysters in FC-T had higher total weights (116 g) compared to FG-B (110 g) and FB (104 g), but differences were attributed to the amount of fouling on the shells. The FB-produced oysters had significantly higher wet (21 grams, g) and dry meat weights (3.3 g) compared to FC-T (18 g, 2.5 g) and FC-B (18 g, 2.4 g) (Figure 4). Likewise, condition index was slightly higher in oysters grown in FB (11.0) compared to FC (T,10.6; B,10.3). Condition index is a weight ratio that describes meat yield, in terms of dry meat weight, total wet weight, and dry shell weight (equation below).

Figure 3. Shell height, shell length and survival results for oysters cultured in floating gear. Values with different letters indicate significant differences (p<0.05) among treatments.

Figure 4. Meat weight (wet and dry) and condition index results for oysters cultured in floating gear. Values with different letters indicate significant differences (p<0.05) among treatments.
Results: Appearance
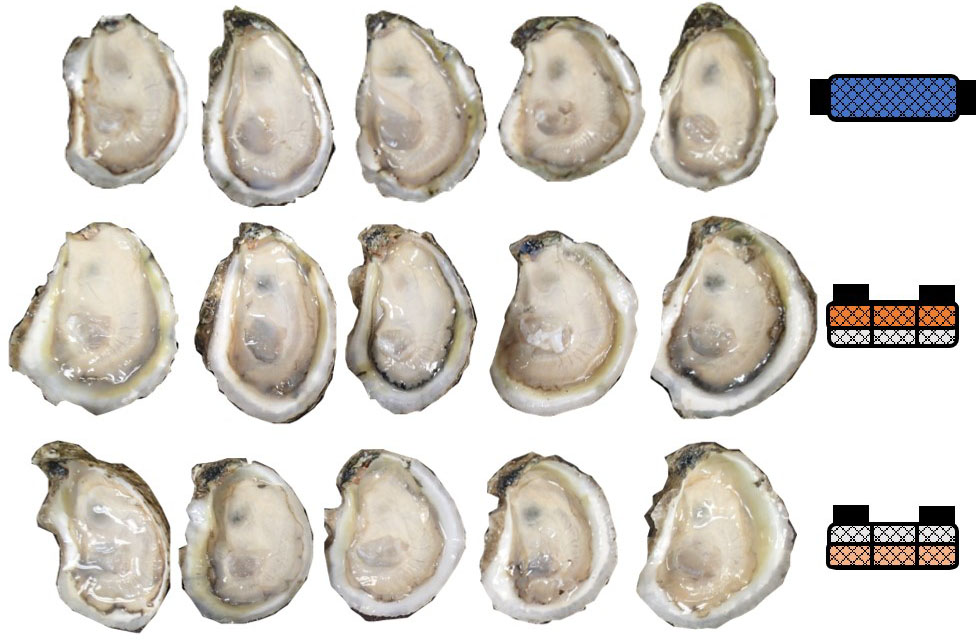
Appearance of oyster meats from the floating gear types are shown in Figure 5. Shell measurements (height, length, width) are used to calculate fan and cup ratios to determine if the shell shape is appealing for the half shell market. Fan ratio is calculated by dividing the shell length by shell height (SL/SH) and cup ratio is calculated by dividing shell width by shell height (SW/SH). Industry experts consider fan ratios above 0.66 and cup ratios above 0.33 to be favorable for oysters designated for the half shell market. Although oysters in all gear treatments exceeded the preferred fan and cup rations, oysters in FC had significantly higher fan ratios (T, 0.77; B, 0.79) compared to oysters in FB (0.71). In contrast, oysters in FC and FB had similar cup ratios (0.38-0.39).
Results: Biofouling Control
Biofouling on Oysters
This study was conducted from September 2017 to June 2018, which is considered a “winter” growout as most of the culture period was over the cooler winter months. In Florida, biofouling is predominately a problem during the warmer summer months when environmental conditions enable fast oyster growth as well as fast growth of fouling organisms. To quantify biofouling in this study, oysters were weighed before and after removal of all fouling organisms from the shells, then wet meat weights were subtracted from total weights to determine percentage of fouling weight (see equation below). Oysters in FC-T had significantly higher biofouling (11%), almost two times the amount observed on oysters in FB (5%) and three times that of oysters in FC-B (3%) (Figure 6). The predominant fouling organism was barnacles, followed by naturally occurring (“wild”) oyster spat (Figure 7).
Figure 6. Percent biofouling on oysters and bags supported by floating gear. Values with different letters indicate significant differences (p<0.05) among treatments.
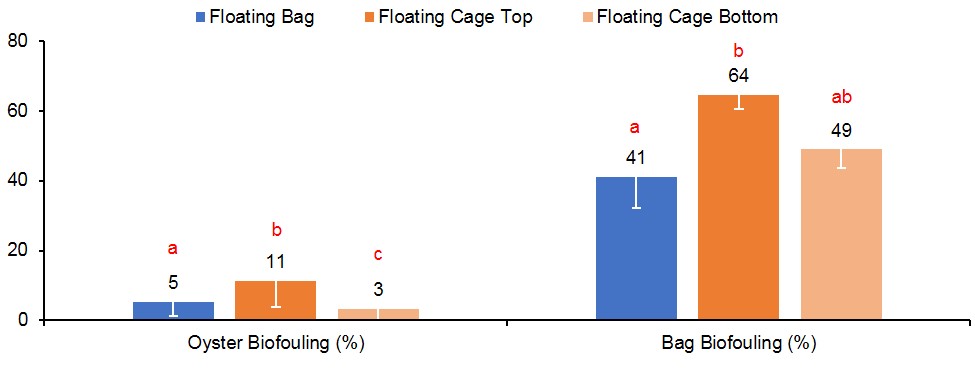
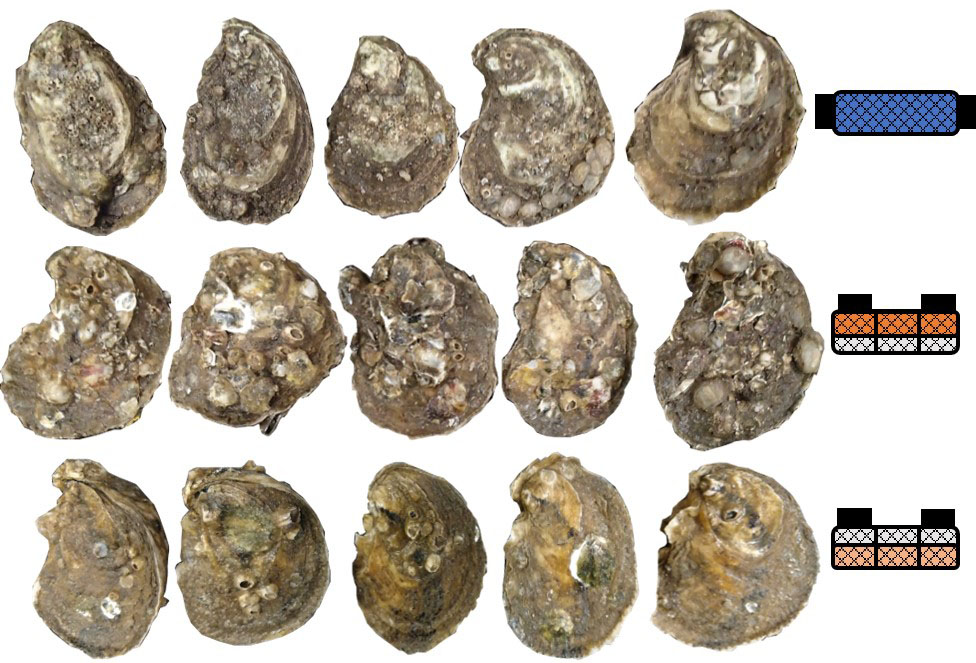
Figure 7. Biofouling on oysters harvested from floating culture gear.
Biofouling on Gear
Biofouling accumulation on the gear was quantified by weighing bags immediately after harvest and subtracting the weight from the corresponding pre-deployment bag weight expressed as a percentage (see equation below). Gear type treatment did have a significant effect on biofouling found on the bags (Figure 8). Bags in FC-T had the highest fouling with an average weight of 3.7 lbs (64%), almost two times the fouling observed on bags in FC-B (1.9 lbs, 49%) and FB (1.5 lbs, 41%). Again, barnacles were the predominate fouling organism (Figure 8).

Figure 8. Biofouling on bags supported by floating culture gear at harvest.

A summary of data generated from this study, including averages and standard deviations of variables measured, and probability (p) values for the Kruskal-Wallis and post-hoc Dunn’s statistical tests, can be found here.
Summary
In this study, production of oysters cultured in two floating gear types was commercially acceptable. Although statistical differences were found among gear types, growers would most likely not differentiate among values obtained for growth, weights, and condition index. However, significant differences detected in biofouling have management implications for a grower as floating bags (FB) and bags placed on the bottom level of floating cages (FC-B) had the least amount of fouling compared to bags placed on the top level of floating cages (FB-T). Since floating bags do not need to be “flipped back” to a growing position like floating cages, labor and costs (fuel, boat, etc.) can be reduced by half. An effective biofouling control strategy for floating cages would be to rotate bags from top to bottom as culling and sorting activities take place to reduce the amount of fouling, though this was not examined in this study. Control practices in this study were effective in reducing biofouling as most of the culture period was conducted during the cooler months but may not be as effective during a summer growout period when biofouling is at its peak.
Presentation
Gear Type Comparison for Off-bottom Oyster Aquaculture in Florida (pdf file)
Presented at 2019 Aquaculture, New Orleans, LA
