
In the second set of growers’ trials, eight growers in four west coast counties (Lee, Franklin, Levy, Wakulla) received oyster seed (2500 diploids – 2N and 2500 triploids – 3N, 21-26 mm in shell height) during March through April 2017 (see March 2017 news article). Growers employed various culture methods, which allowed for evaluation of site and gear interactions with ploidy type. Once oysters were placed in culture units (bags or baskets) at final densities, growers were asked to maintain three replicate bags or baskets for each ploidy type similarly as their other oysters but not to sort, grade, or harvest them. These oysters would be used to document production performance and assess their health under commercial conditions. During October through November after almost eight months in growout and 12 months from spawn, the UF project team sampled oysters from these bags/baskets. As opposed to the first set of trials conducted from July 2016 through March 2017 (eight months), most growers’ diploid oysters had not reached market size within this period. To document growth, samples (n=50) from each bag/basket were measured for shell height, length, and width. Total weights and meat weights (wet) were also recorded. Survival was determined by counting the number of live and dead oysters in each bag/basket. Five oysters from each bag were shipped to Dr. Susan Laramore with FAU-Harbor Branch Oceanographic Institute to examine the presence of internal and external parasites. Additional samples were preserved for later analyses of dry meat weight, condition index, biofouling, and ploidy verification.
Results: Growth and Survival
Growth in terms of shell height and meat weight for diploid and triploid oysters cultured in bottom cages at Pine Island, floating bags at Cedar Key (CK-3 and 4), floating cages at Oyster Bay (OB-3), and floating cages at Alligator Harbor (AH-1) is illustrated in Figure 1. Oysters grown at the Pine Island farm location were harvested in July (2017) after four months in growout as biofouling on the bottom cages was difficult to maintain. Data from two growers was excluded from this summary due to confusion of how to maintain the samples. Triploid oysters were larger (shell height) and meats weighed more than diploid oysters at each site except for oysters cultured in floating cages at Oyster Bay. Interestingly, this was the only location where diploid growth was similar to triploids in both trials. Average shell height of diploid oysters ranged from 52 mm (2.0”) at Oyster Bay-3 to 75 mm (3.0”) at Cedar Key-3. Meat weights followed a similar trend ranging from 3-4 g among diploids and 3-7 g among triploids.
Figure 1. Differences in growth in terms of shell height (top) and meat weight (bottom) of diploid (2N) and triploid (3N) oysters cultured at five farms located in four Florida west coast counties. These data were averaged for three sample bags obtained from participating growers.
![]()
![]()
Survival of diploid and triploid oysters at the participating farms is more difficult to address as survival was only determined for oysters in the “sample” bags, not for the entire crop. However, relevant observations from sample bags were documented. In the second set of trials, survivals were overall lower than those in the first set of trials regardless of ploidy, farm location, or gear type. At the Cedar Key farms, survivals for both ploidies were similar (2N: 68-70%, 3N: 57-68%). At the Oyster Bay farm, survivals were higher than those at Cedar Key but, again, similar for both ploidy types (2N: 82%, 3N: 85%). Differences in survival were observed between ploidy types at the Alligator Harbor farm site. Survival of triploid oysters was 92%, the highest obtained at all farm sites in this set of trials, whereas survival of diploid oysters was 67%. Oyster survival for the Pine Island location was not estimated due to the early termination of the trial.
Examples of oysters cultured at the various farm locations are shown in Figure 2. Differences in shell shape and fouling can be observed by ploidy type and farm location. As in the first trials, oysters grown in Cedar Key exhibited the most biofouling. This time, barnacles were the dominant organism whereas natural oyster spat were predominant in the first trials. This was consistent with results obtained in the UF field trials, which were conducted using similar gear and management practices. Oysters grown in Oyster Bay and Alligator Harbor had substantially less fouling consisting primarily of barnacles. In an attempt to quantify the amount of fouling on the oysters, organisms were scraped from the shells of both diploid and triploid oysters and weighed. The oysters were then shucked and shells weighed. Biofouling was expressed as a percentage of the fouling weight to the corresponding shell weight (Figure 3). At the Cedar Key farms, fouling was significantly lower for triploid oysters (43-57%) than the diploid oysters (81-143%), as opposed to the other two locations where fouling amounts were overall lower but similar for both ploidy types.
Figure 2. Diploid (2N, blue tags) and triploid (3N, orange tags) oysters sampled from farms in Cedar Key (CK-3 and 4), Oyster Bay (OB-3), and Alligator Harbor (AH-1).
Figure 3. Biofouling on diploid (2N) and triploid (3N) oysters grown at four farm locations (Cedar Key-3&4, Oyster Bay-3, and Alligator Harbor-1) expressed as a percentage of the dry shell weight.
![]()
Results: Water Quality Conditions
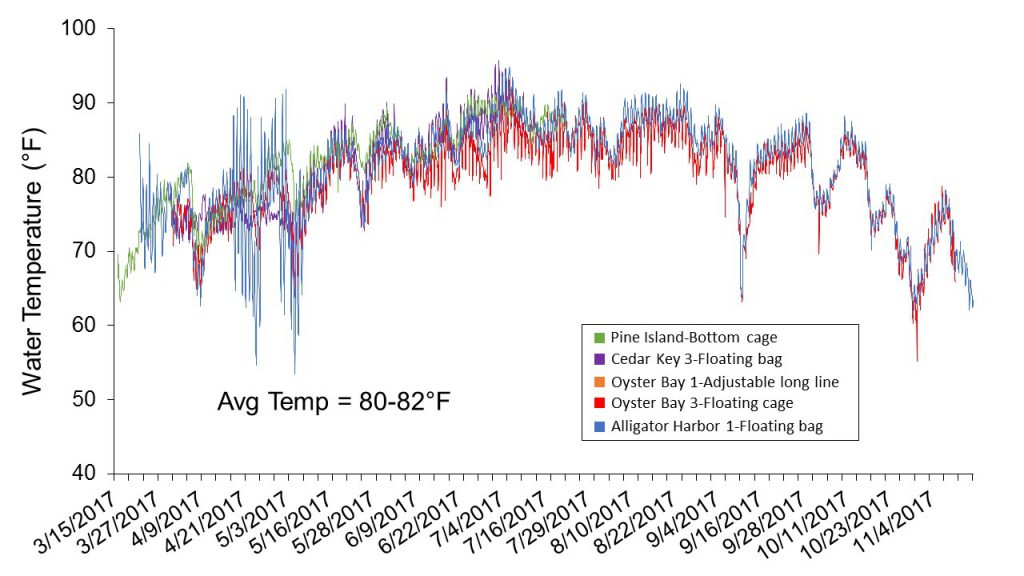
Water temperature was monitored at each farm site by providing growers with a HOBO® data logger to place inside one of their culture bags. The loggers were set to record temperature every 30 minutes. At harvest, the loggers were retrieved and data downloaded. High summer temperatures (>85oF) were suspected to have played a role in lower growth and survival throughout these trials (Figure 4). Average temperature at each farm site over the eight-month culture period of March-April through October-November ranged from 80 to 82oF, as opposed to averages of 71 to 81oF obtained in the first set of trials, which were conducted from July (2016) through March (2017). Although temperature variation among farm locations was minimal in these trials, fluctuations resulting from management practices were observed. For example, temperature spikes associated with floating cages at Oyster Bay-3 likely reflect air temperatures recorded while the gear was flipped for aerial drying. The temperature spikes recorded at the Alligator Harbor-1 location during the first two months cannot be explained.
Refractometers were provided to growers to record salinity at the respective sites. Based on these and other data collected by the Department of Agriculture and Consumer Services (DACS) Shellfish Environmental Assessment Section at monitoring stations located nearby lease areas, the farms at Cedar Key, Alligator Harbor, and Charlotte Harbor were designated as “high” salinity sites (25-30 ppt), while farms at Oyster Bay was considered “medium” salinity sites (approximately 20 ppt). Although on wet years, these locations can experience lower salinities. A “low” salinity site (15-20 ppt) was not included in this demonstration as there are very few oyster farms in Florida located in more brackish waters.
Figure 4. Water temperatures recorded from March through November 2017 at five oyster farms located in four west coast Florida counties.
Results: Seasonal Comparison
Differences in oyster production between the two seasonal trials were apparent at all farm locations. Growth was substantially slower during the second set of trials when most of the culture period occurred during warmer water temperatures (farm averages: 80-82oF) as compared to the first set of trials, which were conducted at lower water temperatures (farm averages: 71-81oF) (Figure 5). Warm water temperatures, characteristic of shallow coastal waters in Florida, enable year-round growth and shorter crop periods; however, excessively high temperatures in the summer months may inhibit growth and increase stress, resulting in increased mortalities. Other seasonal variables may have contributed to differences observed. For example, abundance and composition of phytoplankton (the primary food source for oysters) may vary seasonally. Biofouling may also vary in terms of intensity and species. Mud worms (Polydora websteri), which can deteriorate shell structure and appearance, were more prevalent across the growing sites during the “summer” growout (second set of trials) when compared to “winter” growout (first set of trials) (Figure 6).
Figure 5. Seasonal variations in growth (shell height) of diploid (2N) and triploid (3N) oysters grown at three sites on Florida’s west coast.
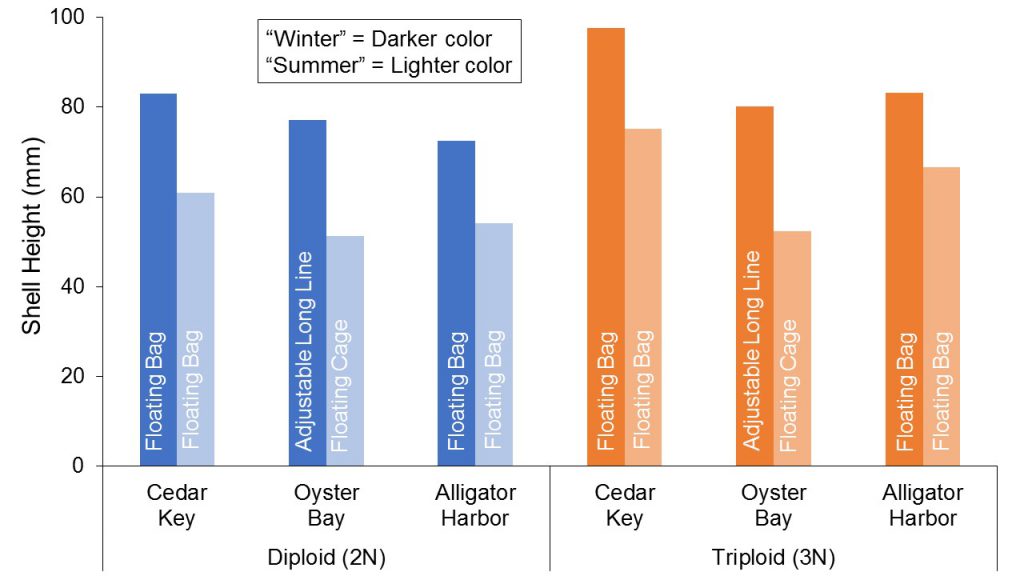
Figure 6. Oyster shells with various levels of mudworm infestation. These markings, known as “blisters”, are caused by a polychaete worm that burrows into the shell. This may result in the shell becoming brittle, a less attractive product for the half shell markets, and can result in off flavors.
![]()
Summary
Natural triploids of the eastern oyster Crassostrea virginica have been available in the U.S. only for the past 10-15 years and not until 2014 in Florida. These growers’ trial demonstrated the viability of triploid production through summer months. Paired with results from the first set of growers’ trials, this project documents advantages of triploidy, including faster growth, shorter crop times, better shell shape, reduced risk of parasites, and year-round availability. The project also provides information on diploid and triploid oysters cultured using different gear types at several farm locations on Florida’s west coast.
Figure 7. Growers, who participated in the second set of field trials, and their oysters.
![]()