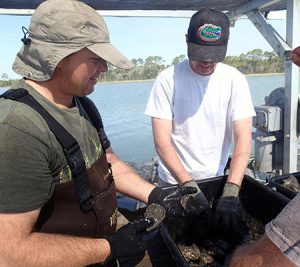
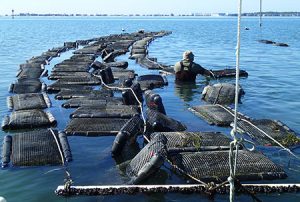
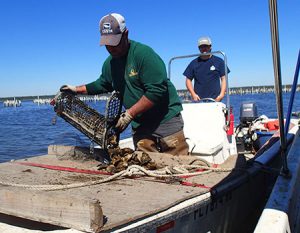
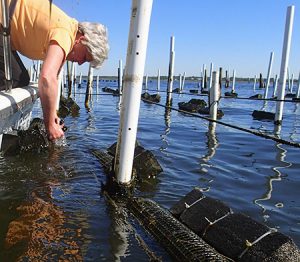
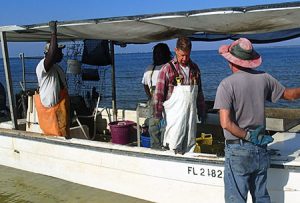
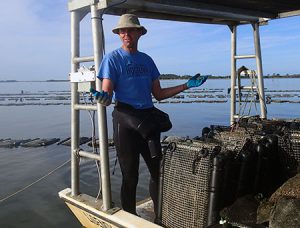
Ten growers in four west coast counties (Charlotte, Franklin, Levy, and Wakulla) participating in this project received oyster seed (2500 of each ploidy type, 20-22 mm in shell height) during July 2016 to grow on their leases. These growers used a variety of culture methods, which allowed for evaluation of site and gear interaction on ploidy type. To document production performance and assess health of diploid (2N) and triploid (3N) oysters under commercial conditions, oysters from three replicate bags (four baskets if using the adjustable longline system) for each ploidy type were provided to the UF project team at harvest. These bags were stocked at a final density used by the grower and maintained similarly as other culture bags except they were not to be sorted or graded for harvest. In March (2017) after almost eight months in growout, UF staff collected oysters from these bags. Several growers noted that oysters had reached market size one to two months earlier and would have typically been sold then, which may have affected their results. To document growth, samples (n=50) from each bag were measured for shell height, length, and width. Oysters were also weighed for total and meat (wet) weights. Survival was determined by counting the number of live and dead oysters in each bag. A sample of five oysters per bag per grower were shipped to Dr. Susan Laramore for determining presence of internal and external parasites. Samples were also preserved to verify ploidy, and additional samples were frozen to analyze later for dry meat weight, condition index, and biofouling.
Results: Growth and Survival
The graphs below (Figure 1) illustrate growth in terms of shell height and meat weight for triploid and diploid oysters cultured in bottom cages at Charlotte Harbor and Cedar Key (Cedar Key-2), floating bags at Alligator Harbor (1&2) and Cedar Key (Cedar Key-1), and baskets supported by the adjustable longline system (ALS) at Oyster Bay. Two of the growers participating in Cedar Key lost most of their oysters during Hurricane Hermine in September so no information was obtained from them. Due to a misunderstanding of how to set aside oysters for the UF samples, it was decided not to include information from one of the Wakulla County growers in this summary. Triploid oysters were larger and meats weighed more than diploid oysters at each site with the exception of oysters cultured with the ALS system in Oyster Bay; however, growth was similar for both ploidy types at this site. Again, except for the Oyster Bay location, average shell height of triploid oysters ranged from 73 mm (2.9”) at Alligator Harbor-1 to 98 mm (3.9”) at Cedar Key-1, confirming growers’ observations that oysters exceeded market size. These oysters were harvested just 11 months from when they were spawned in April 2016. In contrast, average shell height of diploid oysters ranged from 65 mm (2.6”) at Alligator Harbor-1 to 83 mm (3.3”) at Cedar Key-1. Although smaller, these oysters had also reached market size in this time frame. Meat weights followed the same trends for ploidy type and farm location. It is interesting to note that at the Cedar Key-1 farm, average meat weight of triploid oysters (14 grams) doubled that of diploid oysters (7 grams).
Figure 1. The differences in growth in terms of shell height (top graph) and meat weight (bottom graph) of diploid and triploid oysters cultured at six farms located in four west coast counties are shown. These data were averaged for 3-4 sample bags obtained from participating growers. White lines at the top of each bar represent the standard deviation, which is the variation within replicate sample bags.
![]()
![]()
Survival of diploid and triploid oysters at the participating farms is more difficult to address as survival was only determined for oysters in the “sample” bags, not for the entire crop; however, growers’ observations are included here. In Charlotte County, high mortality was observed. It is reasonable to assume this was associated with the prolonged red tide bloom in the area, which prohibited harvesting of oysters, and to the higher water temperatures recorded at this location (see temperature graph below). The grower indicated that most of the mortalities had occurred one month prior to obtaining the sample bags. Further, the grower reported he moved bottom cages several times in an effort to find hard bottom within the lease area. The grower at Cedar Key-1 stocked oysters at approximately 150/bag for the final growout stage in bags supported by square floats attached to the sides of bags. At harvest, oysters were extremely fouled with natural oyster spat. Also, the oysters were large, resulting in bags tightly packed and heavy. Although survival was high for both ploidy types (averages 98 to 99%), the presence of overset may have led to some “wild” oysters being counted as live oysters. Lower survival was observed in oysters grown using bottom cages in Cedar Key-2 (average of 89% in 3N sample bags and 91% in 2N sample bags); regardless, these results are commercially acceptable. Little fouling was observed on these oysters despite being grown in submerged cages. The grower pressure washed cages periodically on the lease using a trash pump. Further, the grower observed that oysters had thinner shells, which resulted in some breakage. The grower in Oyster Bay using the ALS system produced smaller oysters, but had high survival in all sample baskets (99-100%). The two growers in Alligator Harbor, who used floating bags supported with bullet floats, remarked that oysters were larger than they normally would have kept. These heavier bags began to sink prior to harvest; however, minimal fouling was observed on these oysters. Both growers employed biofouling control methods by flipping and shaking bags on a routine basis. Survival of oysters in sample bags was high for both growers and ploidy types, averages ranging from 97-99%.
The pictures below are representative of oysters sampled from the six farms (Figure 2). Differences in shell shape and fouling can be observed by ploidy type, gear type, and farm location. The most heavily fouled oysters were from Cedar Key-1 as noted above, with naturally occurring oyster spat being the dominant organism. This coincides with results obtained in the UF field trials, which were conducted at the same lease area using similar gear (see next news article). Interestingly, the bottom cages used at a different lease area in Cedar Key-2 resulted in little fouling; but as mentioned above, bags were pressure washed routinely. Oysters grown at Charlotte Harbor and Oyster Bay had some oyster spat and barnacles on the shells. The least amount of fouling was observed on oysters grown at Alligator Harbor. Biofouling, expressed as a percent dry weight of fouling organisms to shell weight, will be analyzed later using frozen samples. No infestations of the burrowing mudworm (Polydora websteri) were found on oysters grown at any of the farm sites.
Figure 2. Pictures of diploid (2N, blue tags) and triploid (3N, orange tags) oysters sampled from farms located on Florida’s west coast.
Oysters samples from bottom cages, Charlotte Harbor, Charlotte County (diploids on left and triploids on right).
Oysters samples from floating bags, Cedar Key-1, Levy County (diploids on left and triploids on right).
![]()
Oysters samples from bottom cages, Cedar Key-2, Levy County (diploids on right and triploids on left).
![]()
Oysters samples from baskets supported by an adjustable longline system, Oyster Bay, Wakulla County (diploids on left and triploids on right).
![]()
Oysters samples from floating bags, Alligator Harbor, Franklin County, AH-1 on left nd AH-2 on right (diploids on right and triploids on left).
Overall, the project has established multiple demonstration sites at commercial shellfish aquaculture leases in four counties on Florida’s west coast. Natural triploids of the Eastern oyster Crassostrea virginica have been available only for the past 10 years elsewhere in the U.S., and not until 2014 in Florida. The techniques should work well for Florida oyster growers and provide the benefit of limiting natural reproduction. This project documents potential advantages of triploidy, such as faster growth, shorter crop times, less risk of disease, and availability of year-round quality oyster meat. The project also provides information on diploid and triploid oysters grown using different gear types at different farm locations with varying salinity regimes.
Results: Water Quality Conditions
Water temperature was monitored at each of the farms by providing growers with data loggers to place inside oyster bags/baskets. The loggers were set to record temperatures every 30 minutes. At harvest, the loggers were retrieved and data downloaded. The graph below displays water temperatures from July (2016) through March (2017) at five farm locations (Figure 3). The logger at one of the Alligator Harbor sites malfunctioned. These data reveal not only differences among locations but also differences related to gear type and culture practices used. For example, water temperatures at the southernmost location were consistently higher throughout the year than other locations, which contributed to faster growth rates observed. The lowest water temperatures were recorded at the Oyster Bay farm where the ALS system was used. The extreme drops in temperatures most likely reflected times when oyster baskets were exposed to air for drying. It may not be coincidental that oysters sampled from this location were also the smallest obtained. The water temperatures recorded in a floating bag at Cedar Key-1 were similar to those recorded in a bottom cage at the other Cedar Key-2 location; thus, gear type did not influence water temperatures at these farms, which are located in shallow, inshore coastal waters.
Figure 3. Water temperatures recorded from July 22, 2016 to March 29, 2017 at five oyster farms located in four west coast counties are shown.
![]()
To document salinities at the various farm locations, a refractometer was provided to each grower. The farms at Cedar Key, Alligator Harbor, and Charlotte Harbor were considered “high” salinity sites (values ranging from 25 to greater than 30 ppt), while Oyster Bay was considered a “medium” salinity site (values around 20 ppt). Although on “wet” years, these locations can experience lower salinities. A “low” salinity site (values between 15-20 ppt) was not included in this demonstration; currently, there are no oyster farms in the state located in more brackish waters. These salinity designations were made based on water quality data collected by FDACS Division of Aquaculture staff, who monitor these shellfish harvesting areas on a monthly basis.
Figure 4. Pictures of oyster growers participating in the project.


